Sunday, November 20, 2022

Is It Time to Stop Harping on "Digital Transformation?"

If one defines digital transformation “as the integration of digital technology into all areas of a business resulting in fundamental changes to how businesses operate and how they deliver value to customers,” you can see why it is so hard to measure. 


DX affects “all” of the business; produces “fundamental change” in “operations and value” creation, it often is said. How often does any single technology change or program affect “the whole business?” How often does any technology program produce “fundamental change” in operations or value creation? 


Also, by that standard of “fundamental change,” many industries arguably already have achieved most of the value of DX. If “value for customers” is correlated with “how we make our money,” then content businesses and many retailers already have succeeded, for the most part. They sell online; they fulfill remotely; they handle customer interactions online. 


CaixaBank Research


Many other industries, such as marketing, consulting and research, likewise largely rely on online processes and fulfillment. Other industries possibly cannot pursue “fundamental transformation.” 


The qualifications, such as saying DX “will look different for every company,” only highlight  the problem. DX requires technology, to be sure, but also cultural change. And how do you measure that? 


Some might say DX requires a “culture of experimentation; a willingness to fail or an ability to successfully challenge older ways of doing things.” Some of us would say success in any single one of those areas will succeed only about 30 percent of the time. 


So what people often do not expect is failure. And there is no reason to believe any single effort at some part of DX will succeed more often than three times out of 10. 


source: BCG 


The e-conomy 2022 report produced by Bain, Google and Temasek provides an example of why DX is so hard to define or measure. Literally “all” of a business, all processes and economic or social outcomes are linked in some way to applied digital technology. 


And what we cannot precisely quantify or measure is hard to track or monitor. If one thinks of DX as simply the latest description of “applying digital technology” to processes, then one also understands why there actually is no end point. We simply keep evolving our technology use over time. 

source: Harvard Business Review 


We should not expect people and organizations to stop talking about “digital transformation.” But maybe we shouldn’t listen quite so much. 


Yes, by all means continue to experiment with new ways to apply internet, communications and  computing technologies to improve operations, product value and customer interaction capabilities.


You know, like we always have done.


Saturday, November 19, 2022

Politicians Pile Onto Twitter, But Everyone is Cutting Lots of Jobs in Tech

Within a matter of days in November 2022, Twitter fired half of its workforce (3750 people), Amazon and Meta both cut over 10,000 jobs in mass layoffs. Other firms in technology, applications did the same. Asana cut 97 jobs. Zendesk sliced 350. Salesforce laid off 950 people. Stripe got rid of 1100. 


One month before, F5 laid off 100 workers; Microsoft 1,000; Oracle 201; Intel 100. Cuts were made by tech firms in the months prior to October as well. 


Many companies also instituted hiring freezes.  Globally, an estimated 200,000 tech workers have lost their jobs already, and more should be expected, as firms brace for a business slowdown of significant magnitude. 


source: Trueup


The point is that big layoffs are happening everywhere, as business leaders prepare for a recessionary environment. Only Twitter seems to be generating politician calls for action, which illustrates the political nature of such views.  All the other layoffs--business adjustments leaders have taken because they expect harder times--are ignored. 


Only Twitter generates ire and calls to “do something.” And that shows, more than anything, the politically-motivated nature of the calls for action against Twitter.


Fixed Wireless is the Clear Early Example of New 5G Revenue

At the moment, 5G fixed wireless is the clear contributor to new revenue sources earned by 5G networks. No other use case has produced the volume of new revenue. 


Revenues from 5G fixed wireless, in the near term, will dwarf internet of things, private networks, network slicing  and edge computing, for example. 5G fixed wireless might, in some markets, represent as much as eight percent of home broadband revenues, for example. None of the other sources is likely to hit as much as one percent of total revenues in the near term. 


The center of gravity of demand for 5G fixed wireless is households In the U.S. market who will not buy speeds above 300 Mbps, or pay much more than $50 a month, at least in the early going. T-Mobile targets speeds up to 200 Mbps. 


Verizon fixed wireless service plans also suggest that existing Verizon mobile customers are key targets. In the meantime, there is 4G fixed wireless, which will have to be aimed at a lower-speed portion of the market, albeit at about the same price points as 5G fixed wireless. 


Up to this point, Verizon 4G fixed wireless, available in some rural areas, offers speeds between 25 Mbps and 50 Mbps. That might appeal to consumers unable to buy a comparable fixed network service. 


By some estimates, U.S. home broadband generates $60 billion to more than $130 billion in annual revenues


If 5G fixed wireless accounts and revenue grow as fast as some envision, $14 billion to $24 billion in fixed wireless home broadband revenue would be created in 2025. 


5G Fixed Wireless Forecast


2019

2020

2021

2022

2023

2024

2025

Revenue $ M @99% growth rate

389

774

1540

3066

6100

12,140

24,158

Revenue $ M @ 16% growth rate

1.16

451

898

1787

3556

7077

14,082

source: IP Carrier estimate


If the market is valued at $60 billion in 2021 and grows at four percent annually, then home broadband revenue could reach $73 billion by 2026.


2022

2023

2024

2025

2026

Home Broadband Revenue $B

60

62

65

67

70

73

Growth Rate 4%


Higher Revenue $B

110

114

119

124

129

134

source: IP Carrier estimate


If we use the higher revenue base and the lower growth rate, then 5G fixed wireless might represent about 10 percent of the installed base, which will seem more reasonable to many observers. 


Assuming $50 per month in revenue, with no price increases at all by 2026, 5G fixed wireless still would amount to about $10.6 billion in annual revenue by 2026 or so. That would have 5G fixed wireless representing about 14 percent of home broadband revenue, assuming a total 2026 market of $73 billion.


If the home broadband market were $134 billion in 2026, then 5G fixed wireless would represent about eight percent of home broadband revenue. 


Fixed wireless might be even more important elsewhere in global markets.  


Critics are correct that 5G fixed wireless--at least in the medium term--has capacity limitations compared either to fiber-to-home or advanced hybrid fiber networks. But it also is true that the home broadband market has a value segment for whom fixed wireless seems to be in demand. 


According to the latest data from Leichtman Research Group, during the third quarter of 2022, some 825,000 net new home broadband accounts were added in the U.S. market. But the two major fixed wireless service providers--T-Mobile and Verizon--added 920,000 net accounts during the quarter. 


Fixed Wireless Services, Third Quarter 2022

Fixed Wireless Supplier

Total Accounts

Net Additions

T-Mobile

2,122,000

578,000

Verizon

1,063,000

342,000

source: Leichtman Research Group


Total cable industry net adds were about 39,000, while telcos collectively lost about 136,000 fixed network accounts. 


During the third quarter, about 22 percent of U.S. customers bought service at speeds of 200 Mbps or below. In other words, perhaps a fifth of the home broadband market is willing to buy service at speeds supported by fixed wireless. 
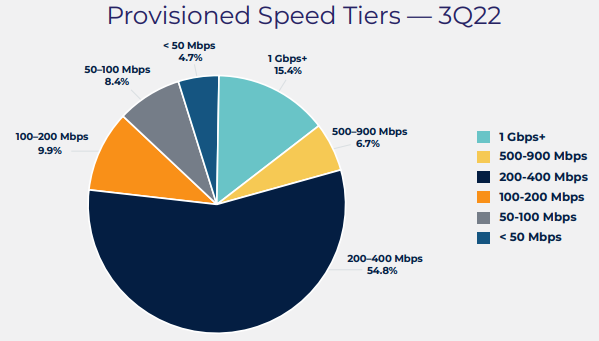

source: Openvault  


Predictably, supporters and detractors offer the expected defense of advantages and weaknesses. Cable operators note the bandwidth limitations. Verizon and T-Mobile point to the ease of installing and price advantages. In some cases fixed wireless might actually be faster than the other alternatives available from other local home broadband providers. 


Critics do correctly note that fixed wireless home broadband is carefully marketed in areas where new 5G networks have spare capacity. That capacity will disappear as 5G adoption increases, the critics say.


But Verizon and T-Mobile might argue they have ways to boost capacity over time, as 5G networks are used more heavily and as bandwidth demand keeps increasing. Higher-capacity millimeter wave spectrum is the obvious early answer. 


Longer term, Verizon and T-Mobile are likely to explore ways to add fiber to home coverage as well. For Verizon, that means finding new says to secure FTTH capacity outside its historic fixed network footprint. For T-Mobile, that means getting into FTTH for the first time. 


Up to this point, T-Mobile has been focused on areas where there is less competition, such as rural markets. 


Verizon’s geography is the roughly 80 percent of U.S. homes outside Verizon’s fixed network service territory, as well as its own mobile customer base, who are encouraged to bundle fixed wireless with existing mobile service. 


The point is that the near-term market is substantial for both T-Mobile and Verizon in “out of region” geographies. For T-Mobile that is 100 percent of U.S. homes. For Verizon that is about 80 percent of U.S. homes. 


Friday, November 18, 2022

Will Digital Infra Privatization Rates Slow?

Higher interest rates affect most parts of any economy. What we will have to see is the impact on digital infrastructure ownership in the near term. If interest rates climb to five percent or more, it is going to affect the payback model for taking digital infra (towers, data centers, distribution networks) private.


The wave of private equity purchases of formerly public infrastructure from service providers would slow. How much slower is the issue, and for how long. Observers do not expect five-percent (or higher) interest rates for the long term, but activity will hinge on the level of rates and their duration. 


In fact, the whole digital infra privatization business has been fueled by near-zero “real” interest rates. Inflation rates also matter, as they affect “real” interest rates. For the whole class of “alternative” infrastructure (power utilities, roads, airports, oil and gas, renewable energy and data centers, towers and fiber infrastructure), expected returns have been dropping, and specific returns for digital infra might arguably be closer to five percent than 10 percent. 


source: McKinsey 


But that is why five-percent interest rates slow activity. If the expected return is five percent, borrowing costs are five percent and inflation rates are high, investments no longer make sense. 


The point is that it would not be unexpected to see a slowdown in digital infra privatizations for a while. The business case--with higher interest rates--does get worse.


Comcast Expects 10-Gbps Downstream Upgrade to Cost "Less than $200 Per Passing"

Comcast says it can initially upgrade its network to eventually handle symmetrical 10-Gbps internet access (supporting 10 Gbps initially) for “less than $200 a home passed,” according to Elad Nafshi, Comcast EVP and chief network officer. 


It is a nuanced statement. 


That initial upgrade cost includes revamping networks from low-split to mid-split, including changes to active and passive network elements when necessary to support an upgrade to DOCSIS 4.0 10-Gbps downstream bandwidth. Upstream will increase to perhaps 1 Gbps. 


Significantly, Comcast’s initial deployment does not require full fiber distribution, but can accommodate as many as four amplifiers in cascade. 


That means the upgrade to 10-Gbps downstream service can be done without upgrading the whole network to fiber, which uses passive coaxial cable only for the last 100 feet or so of drop cable. 


Upgrading to symmetrical 10-Gbps service will require replacing all the radio frequency amplifiers. Typically, Comcast has built out fiber to an optical node, then delivered signals to home using a string (cascade) of up to four amplifiers running on coaxial cable. 


In the first stage of DOCSIS 4.0 deployment,  most of Comcast’s facilities can continue to operate with fiber distribution to a node, then retain as many as four RF  amplifiers for service to homes. There are huge cost implications for retaining that capability, since Comcast can continue to use the in-place amplifiers and coaxial cable. 


Future “Node + 0 amplifier” networks will transition to Full-Duplex (FDX) DOCSIS, to significantly increase the upstream bandwidth to multi-gigabit speeds, such as symmetrical 10-Gbps service. But that also will require deploying a full fiber network, using coaxial cable only for the drops. 


The first step will be a shift to a 5-MHz to 204-MHz upstream bandwidth and 1218 MHz downstream bandwidth, supporting a 1 Gbps upstream tier and multi-Gbps downstream. In the following illustration, blue frequencies are available for downstream traffic, while red frequencies are available for upstream traffic. 


As usual, the upgrades can be implemented incrementally, in stages, with incremental capital investment. . 


source: Comcast 


Then overlapping bidirectional spectrum from 108 to 204 MHz can be activated. that eventually increases up to the full 108-MHz  to 684-MHz FDX limit. In that implementation DOCSIS 3.0 can be supported up to the 1002 MHz limit and legacy DOCSIS 3.1 to the 1218-MHz limit.


The point is that Comcast still believes it can upgrade its bandwidth over time to symmetrical 10-Gbps service while remaining the low-cost provider compared to rival fiber-to-home networks.


Thursday, November 17, 2022

Without Hedonic Adjustment, You Can't Tell What Has Happened to Home Broadband Prices

It is hard to answer the question “have home broadband prices risen since 2009?” with using hedonic adjustment and also adjusting for inflation. The Bureau of Labor Statistics uses hedonic adjustment to track producer prices for home broadband, for example, since speed and other attributes change over time. 


The rationale is that a dial-up internet connection is not a comparable service to home broadband at various speeds (10 Mbps, 100 Mbps, 1 Gbps, for example). Since prices tend to stay about the same over time while speeds have increased for the “most bought” tiers of service, BLS adjusts prices to account for quality improvements. 

source: Bureau of Labor Statistics 


Trends for voice services are harder to track, as that feature is included in the recurring cost of both mobile and fixed network services. Over a few decades, the cost of fixed network voice services has tended to rise (as actual costs cannot be easily subsidized by higher-profit services, as once was the case). 


The cost of mobile service has tended to drop over time. In October 2022, for example, the U.S. Bureau of Labor Statistics said the cost of mobile service dropped 1.4 percent, hedonically adjusted. 


Home broadband also appears to have gotten cheaper by a bit in the September 2022 CPI report. That figure has to be interpreted, however, as the internet services category includes both internet access and other “electronic information providers.” 


That includes subscriber fees for residential internet access, but also other online services such as web hosting, domain names, and file hosting for non-business use. 


Also, this category includes service bundles that might include telephone and TV services bundled with residential internet service and mobile internet access. Obviously, each of those separate services has a distinct retail cost profile that can skew the figure for what we assume “home broadband” actually costs. 


Other monthly subscriber fees are also included in the  but are not limited to internet rental equipment, Wi-Fi service fees, installation and activation fees, and other associated taxes and fees.  


That noted, we might note that service bundles mean lower prices per product, even when some components such as home telephone service might have rising cost profiles. 


Determining what most customers actually pay does require some analysis of the service plans people actually buy, not simply the posted retail prices. If most customers buy bundles, their costs per service are lower than if they purchased each component separately. 


Still, using the BLS data, we can see a dramatic fall in U.S. internet access prices since about 2017, when hedonically adjusted.


Wednesday, November 16, 2022

FTX, Enron, Lehman Brothers

The collapse of FTX has some commentators suggesting the bankrupt cryptocurrency exchange could produce investor losses or wider fianncial damage on the scale of Lehman Brothers in 2008.


Perhaps others might be tempted to compare FTX bankruptcy impact to  investor losses from Enron the early years of the century. I just cannot see that. 


source: Banking Exchange 


FTX had perhaps $32 billion in equity value a year ago. Enron investors lost perhaps $74 billion.  Lehman Brothers had equity losses of about $60 billion (by some accounting $46 billion in equity destruction) although debt holdings were far larger, up to $613 billion or so, balanced against assets. 


But Lehman equity and debt losses, in total, might have reached as much as $135 billion.  


At least so far, FTX does not begin to approach the damage triggered by Enron’s collapse or Lehman Brothers demise. Enron’s bankruptcy occurred at about the time of the “Dot Com Collapse” around the turn of the century, which destroyed hundreds of billions of dollars of equity value in telecommunications and technology and app firms. 


Lehman’s bankruptcy helped bring on the global Great Recession of 2008. So far, FTX appears to pose none of that magnitude of danger.


DIY and Licensed GenAI Patterns Will Continue

As always with software, firms are going to opt for a mix of "do it yourself" owned technology and licensed third party offerings....