Monday, February 27, 2023

Wider API Use Could Support Either Horizontal or Vertical Business Models

A layered business model might be viewed as a value chain turned 90 degrees. Where a value chain is depicted horizontally, with stages leading to end user purchase of products, so a layered business model resembles a value chain turned 90 degrees to show that layers of function each contribute to a complete business model. 


source: McKinsey 


The thing about value chains is that they feature distinct roles. In principle, those roles can be vertically integrated or remain horizontally distinct. Decentralization or virtualization do not necessarily alter the type of integration. 


source: Blockchain Hackathon 


Wholesale business models, on the other hand, do affect integration patterns, as they are based on a horizontal model: wholesalers supply essential network functions, but customer-facing operations are typically disaggregated. 


Many other potential innovations might shift vertically-oriented telcos in a more horizontal direction, but not necessarily. 


GSMA Open Gateway is a new framework of universal network Application Programmable Interfaces (APIs) designed to provide developers with access to operator network features. That could, in principle, lend itself to new horizontal roles, but might also simply add a revenue stream to an existing vertical model.

"Radical Shift" of ISP Business Models?

There are platitudes and there are threats and opportunities in business.


When European Commission Internal Market Commissioner Thierry Breton says “we need to leave behind our long-standing perception of the way (communications) networks operate,” ecosystem participants have to take notice. 


Speaking at MWC Barcelona, Breton reiterated some themes heard often these days:  “telecommunication networks transforming into platforms;” copper networks are being replaced by optical fiber media; virtual reality is coming; Web 4.0 is coming; coming connectivity networks will be a blend of “transmission, storage and computing.”


None of that is too surprising when uttered by a regulator. But ecosystem participants are right to pay attention when a regulator talks about a  “radical shift” of business models, specifically questioning “the traditional model of vertical integration.”


To be sure, in context, Breton was referring to the “digital industry” in a broad sense. Referring specifically to connectivity providers, Breton said “telcos are demonstrating that they are on their way to become service platform providers.”


Specifically, Breton seemed to be referring to telcos “becoming network-as-a-service providers.” None of that is necessarily a radical shift. In fact, most service providers see “network as a service” as an ancillary revenue stream, and not necessarily as a “revolutionary” move. 


The heart of the matter addressed in his speech is funding mechanisms for gigabit infrastructure, specifically proposed new concepts that would have a few hyperscale app providers paying access providers for the right to land traffic on those networks. 


Those of you familiar with communications network interconnection practices might not find that terribly controversial, in one sense. Public service providers (telcos) always have compensated each other for landing traffic on interconnected networks. 


So internet service providers peer with each other when traffic is roughly equal, outbound and inbound, or assess fees when traffic is asymmetrical. 


Others might find the notion highly controversial. Interconnection applies to asymmetrical inbound traffic between public carriers. The proposed new rules taxing content providers would treat a few hyperscalers as though they were public carriers, even when it is ISP customers who are initiating the sessions and causing the inbound traffic loads. 


Historically, any access provider would bill its own customers for use of the network, using both flat fee and usage-based charging mechanisms based on its own customers’ demand. “Use more, pay more” is the general idea. That has included use of other service provider networks to terminate traffic off the local network. 


Hyperscalers are not public networks. Nor do they initiate access network customer requests. Instead, each ISP’s own customers create the inbound traffic load. In virtually every other industry where usage of network resources happens, customers pay for consumption.


That applies to toll roads, seaport access, natural gas consumption, electricity use, wastewater facilities or airport landing gates, for example.


In this case, as in the other instances, ISP customers are driving the inbound demand, invoking video content, for example, as they might in earlier times have made long distance phone calls, or sent text messages. When customers have paid for linear video subscriptions, the networks fulfilling that demand were not charged because network resources were used. Instead, the subscribers paid. 


In the end, consumers wind up paying for all costs. In the case of taxes on a few hyperscalers for landing traffic, it will be the users of those apps who wind up paying. But that is the point.


ISPs want more money for building their networks and they want somebody else to pay for upgrades. That “somebody else” is users of a few hyperscale apps or business partners of the firms offering those apps. That includes advertisers, merchants and end users. 


And then there are the industrial policy drivers. European and East Asian firms would like to promote indigenous suppliers at home in their battle against competitors based in the United States. Taxes on a few U.S. hyperscalers are viewed within that context by policymakers as well.


Will APIs Boost Mobile Operator Revenue?

Mobile operators always are on the lookout for new revenue sources, and many now hope application programming interfaces can boost revenue. 


GSMA Open Gateway is a new framework of universal network application programming interfaces (APIs) designed to provide developers with access to operator network features, starting with eight features:


  • SIM Swap, 

  • QoD

  • Device Status (Connected or Roaming Status)

  • Number Verify

  • Edge Site Selection and Routing

  • Number Verification (SMS 2FA)

  • Carrier Billing – Check Out

  • Device Location (Verify Location). 


Additional APIs are expected, and GSMA touts the move as similar in potential impact to voice roaming, in terms of enabling global access in a consistent manner. 


Edge Site Selection and Routing supports autonomous vehicles. Verify Location is expected to support  fleet management and incident reporting.


SIM Swap is intended to deter financial crime. “Quality on demand” (QoD) is expected to support low-latency applications such as drone control, robotics, extended reality and immersive online gaming, GSMA says. 


Designed to expose mobile operators’ network capabilities, the effort initially is supported by 21 mobile network operators, 


GSMA itself says the move “represents a paradigm shift.” 


Participants include America Movil, AT&T, Axiata, Bharti Airtel, China Mobile, Deutsche Telekom, e& Group, KDDI, KT, Liberty Global, MTN, Orange, Singtel, Swisscom, STC, Telefónica, Telenor, Telstra, TIM, Verizon and Vodafone.


The level of success might ultimately be determined by developer interest in using those network features and whether and how much mobile operators can create revenue models around the APIs. 


source: Yalantis 


The GSMA Open Gateway has mobile operators in the role of API Provider, while developers are API Consumers. 

source: Yalantis 


The unstated assumption is that developers will find the APIs so compelling they will pay to use them, rather than attempting to create access to those features themselves. The extent of value also hinges on whether a desired value can be sourced in some other way, or does not add enough value to warrant payment of fees.


Sunday, February 26, 2023

What does "Communications" Mean, These Days?

Words have meaning, so changes in words also can have meaning. Consider the “communications” segment of the Standard and Poors 500 index.


The "communications" sector of the S&P 500 includes companies involved in advertising, media, internet services, and telecommunications. Each of those segments operates in different parts of the internet ecosystem, with distinct roles and valuation profiles. Lumping them all together might obscure more than it reveals. 


The firms tracked as part of the S&P 500 “communications index include: 


  1. Alphabet Inc. Class A (GOOGL)

  2. Alphabet Inc. Class C (GOOG)

  3. AT&T Inc. (T)

  4. Charter Communications Inc. Class A (CHTR)

  5. Comcast Corporation Class A (CMCSA)

  6. DISH Network Corporation Class A (DISH)

  7. Meta (META)

  8. Netflix Inc. (NFLX)

  9. Omnicom Group Inc. (OMC)

  10. The Interpublic Group of Companies Inc. (IPG)

  11. Twitter Inc. (TWTR)

  12. Verizon Communications Inc. (VZ)

  13. Walt Disney Company (DIS)


I don’t know about you, but I evaluate asset-light advertising firms quite differently from capital-intensive connectivity firms, and media content owners different from both those other segments. Likewise, I would not consider Alphabet, Twitter and Meta in the same category as advertising, connectivity or content ownership firms. And even if other firms in the index have some streaming exposure, they are not pure-play streamers like Netflix. 


The point is that knowing how the firms in the index have performed financially does not really tell you much about how each of the sectors performed; what their growth rates are or how they should be valued relative to their “peers.” 


Charter, Comcast, Verizon, Dish and AT&T are in one valuation range. Alphabet, Meta, Twitter are in another range. Mobile firms recently have featured EBITDA multiples in the seven range. 


Advertising and marketing firms have had multiples in the 10.6 range. Cable TV companies have been valued at about 7.5 multiples. “Integrated telecommunications services: have a 6.8 multiple. “Online services” garner a multiple of 15.9. 


It does not necessarily illuminate our understanding that firms with such disparate multiples are considered to be in a single index. 


By some estimates, The average P/E ratio for U.S. telcos  was around 20 as of 2021.Online services provider average P/E ratio was around 50 in 2021. By other estimates the ratios were lower. 


Using TTM/GAAP metrics, Verizon’s early 2023 P/E ratio was about 7.7. Comcast in the same period had a 31 P/E while Charter had a 12 ratio. Netflix had a 35 P/E ratio. Alphabet and Meta had ratios close to 20. 


Omnicom had a ratio of about 14.4. Disney, meanwhile, traded at about 55 times earnings. Netflix traded at 34.7 times earnings. 


To be sure, ratios are affected by firm size, growth rates, firm efficiency, debt loads and investor sentiment. 


But you get the point: S&P assembles a single index including firms with wildly-different earnings or price ratios, producing an “average” performance index that might actually obscure more than it reveals.


"Communications" as Viewed by S&P Index Has Lost Meaning

Words have meaning, so changes in words also can have meaning. Consider the “communications” segment of the Standard and Poors 500 index.


The "communications" sector of the S&P 500 includes companies involved in advertising, media, internet services, and telecommunications. Each of those segments operates in different parts of the internet ecosystem, with distinct roles and valuation profiles. Lumping them all together might obscure more than it reveals. 


The firms tracked as part of the S&P 500 “communications index include: 


  1. Alphabet Inc. Class A (GOOGL)

  2. Alphabet Inc. Class C (GOOG)

  3. AT&T Inc. (T)

  4. Charter Communications Inc. Class A (CHTR)

  5. Comcast Corporation Class A (CMCSA)

  6. DISH Network Corporation Class A (DISH)

  7. Meta (META)

  8. Netflix Inc. (NFLX)

  9. Omnicom Group Inc. (OMC)

  10. The Interpublic Group of Companies Inc. (IPG)

  11. Twitter Inc. (TWTR)

  12. Verizon Communications Inc. (VZ)

  13. Walt Disney Company (DIS)


I don’t know about you, but I evaluate asset-light advertising firms quite differently from capital-intensive connectivity firms, and media content owners different from both those other segments. Likewise, I would not consider Alphabet, Twitter and Meta in the same category as advertising, connectivity or content ownership firms. And even if other firms in the index have some streaming exposure, they are not pure-play streamers like Netflix. 


The point is that knowing how the firms in the index have performed financially does not really tell you much about how each of the sectors performed; what their growth rates are or how they should be valued relative to their “peers.” 


Charter, Comcast, Verizon, Dish and AT&T are in one valuation range. Alphabet, Meta, Twitter are in another range. Mobile firms recently have featured EBITDA multiples in the seven range. 


Advertising and marketing firms have had multiples in the 10.6 range. Cable TV companies have been valued at about 7.5 multiples. “Integrated telecommunications services: have a 6.8 multiple. “Online services” garner a multiple of 15.9. 


It does not necessarily illuminate our understanding that firms with such disparate multiples are considered to be in a single index.


Which Came First: the Chicken or the Egg?

Technological determinism--the idea that technology shapes culture, society and history, independent of politics, economics, religion or other cultural forces--might mistakenly be applied in the connectivity and computing businesses. 


In other words, some might think we have the internet because of personal computers, because of Moore’s Law, because of TCP/IP, digital media, smartphones and tablets. One might think we have e-commerce, affordable video conferencing or social media because of broadband internet access, cloud computing or fiber to the home. 


That arguably gets it backwards, as we similarly contend that ubiquitous and high-quality broadband access creates economic growth. The causal relationship is likely the other way: wealth and high rates of economic growth create the demand for quality broadband access, use of smartphones, e-commerce and social media. 


Telco network architectures have undergone significant changes since 1970, looking at the basic switching function. But technology change does not seem to explain the revenue and business model shifts that have transformed the industry. Architecture, for example, does not explain the shift to mobile revenues and the decline of fixed network revenue.


In 2023, in most countries, mobile service represents 70 percent to 80 percent of total service provider revenues. At Verizon, for example, mobility represents no less than 55 percent of total revenues while consumer revenues drive 77 percent of revenue.  
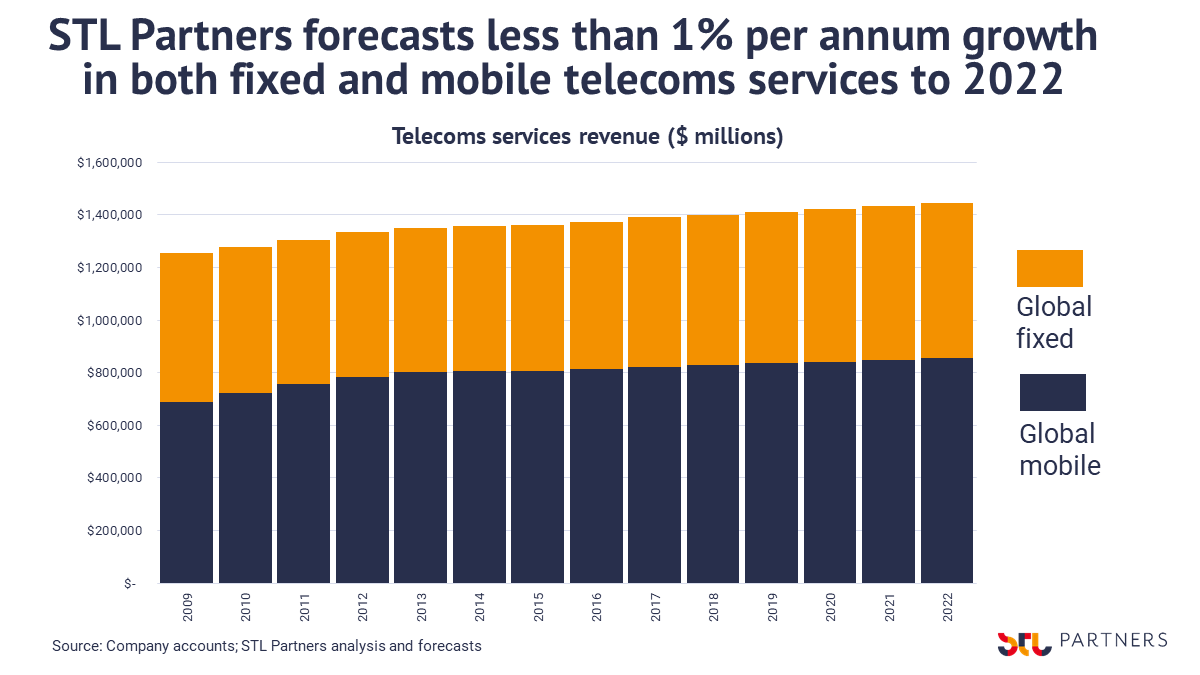

source: STL Partners 


Fixed network revenue as reported to the U.S. Federal Communications Commission and based on revenues contributing to the universal service fund. It is skewed downward because mobile service revenues do not contribute to USF at the same rate as do fixed network services. 


Instead, demand changes--accelerated by the introduction of competition; the value of mobility and the emergence of the internet--seem to explain the key business model changes. Architectural and physical media and switching evolutions seem less important drivers of business model change. 


In the 1970s, for example, telco revenues were dominated by voice services, with the bulk of profit coming from international and long distance calling by business customers.


That began to change a bit in the 1980s, as the conversion to digital switching and Signaling System 7 enabled touch tone dialing, call waiting, call forwarding and voice mail. Some incremental revenues also were generated by business customers using Integrated Services Digital Network. 


Business applications such as video conferencing, remote access, and digital phone systems generated new revenue based on use of ISDN. 


But the bigger change was the shift of revenue from fixed network services to mobile services in the later 1990s and 2000s. 


source: IDATE 


The emergence of demand for internet apps and services also displaced voice as the key driver of fixed network revenues. 


At least some connectivity providers also added significant revenues from entertainment video services. Cable TV companies always had done so, but added voice, then internet access and mobility services. 


Telcos added video to their menus of voice and internet access. By the second decade of the 2000s, mobility and broadband internet access had become the number-one and number-two biggest revenue sources for most access service providers. 


Demand changes explain more of the actual revenue shift in the access business since 1970 than the adoption of digital switching or optical fiber access media. 


Mobile services substantially displaced the fixed network as the preferred way people make phone calls and use messaging or social media. That, of course, requires use of new mobile networks, but the networks did not drive demand. Demand requires the networks. 


Likewise, one might argue that the emergence of the internet drives the demand for broadband access. It is worth noting that consumer demand drives both mobility and broadband access revenue. 


Historically, technology innovations or demand for “advanced” services came from business users. That was true for long-distance calling, ISDN and business phone systems, for example. 


That pattern held in the early days of mobility, but has reversed. Today, consumer users drive mobility revenue magnitudes. Also, internet access drivers were led, early on, by consumer demand. 


The point is that technology changes more often reflect demand changes than cause them. Demand changes, in turn, have been increasingly driven by new value consumers perceive in mobile phones and the internet, with declining value seen in fixed network voice services. 


Though one can document changes in network architectures, signaling methods or physical media changes, business model changes have happened for non-network reasons: competition, the value of the internet and mobility. 


Thursday, February 23, 2023

Home Broadband Should be Funded the Way Any Business Is

The debate over ffunding of home broadband networks by third parties essentially boils down to this argument by internet service providers: our customers use too much data and instead of charging them more, we will tax third parties to make up the difference. 


Some ISPs argue that half or more of the total data consumed by their own customers is because their customers are using a few popular hyperscaler apps. The demand, however, is created by ISP customers. 


If homeowners consume electricity, do we think to tax manufacturers of kitchen appliances or furnaces? Energy customers create the demand and cause the consumption.


Electrical suppliers have the right, perhaps the duty, to structure their tariffs in ways that promote responsible consumption. So do water suppliers or natural gas suppliers or home heating oil suppliers. 


Consumers, in turn, have the right (and again, perhaps a moral duty) to buy appliances that are more energy efficient. Manufacturers have similar pressures and opportunities. 


Governments, policymakers, public policy advocates and suppliers have the right to advocate for any number of funding mechanisms. That is why governments often offer financial inducements for building access networks, require physical facilities sharing and access or offer recurring cost subsidies to low-income consumers. 


Is it really asking too much of ISPs that they learn to structure their business models to support and shape their customers’ behavior?


Directv-Dish Merger Fails

Directv’’s termination of its deal to merge with EchoStar, apparently because EchoStar bondholders did not approve, means EchoStar continue...