Showing posts sorted by relevance for query U.S. household internet. Sort by date Show all posts

Thursday, December 17, 2020

Internet Access Too Expensive; Too Slow?

One often hears complaints that U.S. broadband is “too expensive” or “too slow,” as one hears that municipal internet access services are needed to do the job internet service providers will not do. It always is worth evaluating such claims.


Is U.S. broadband “too slow.” Maybe not. About 80 percent of U.S. households can buy gigabit per second service if they choose, looking only at coverage by cable TV networks. Yes, households in rural areas often cannot buy service at such speeds, but speeds improve all the time, for a greater number of locations. 


According to comparethemarket.com, the United States ranks fifth among 50 for downspeeds.


Is U.S. internet access too expensive? Maybe not. According to a new analysis by NetCredit, which shows U.S. consumers spending about 0.16 percent of income on internet access, “making it the most affordable broadband in North America,” says NetCredit.  


In Europe, a majority of consumers pay less than one percent of their average wages to get broadband access, NetCredit says. In Singapore, Hong Kong, New Zealand and Japan,  10 Mbps service costs between 0.15 percent and 0.28 percent of income. 


Back in 2017, actual U.S. broadband speed was more than 100 Mbps, on average, according to Akamai. Upstream speeds varied by location, but are at or above plan goals in most cities, with performance varying by provider.   


Another study by Deutsche Bank, looking at cities in a number of countries, with a modest 8 Mbps rate, found  prices ranging between $50 to $52 a month. That still places prices for major U.S. cities such as New York, San Francisco and Boston at the top of the price range for cities studied, but do not seem to be adjusted for purchasing power parity, which attempts to adjust prices based on how much a particular unit of currency buys in each country.


source: McKinsey  


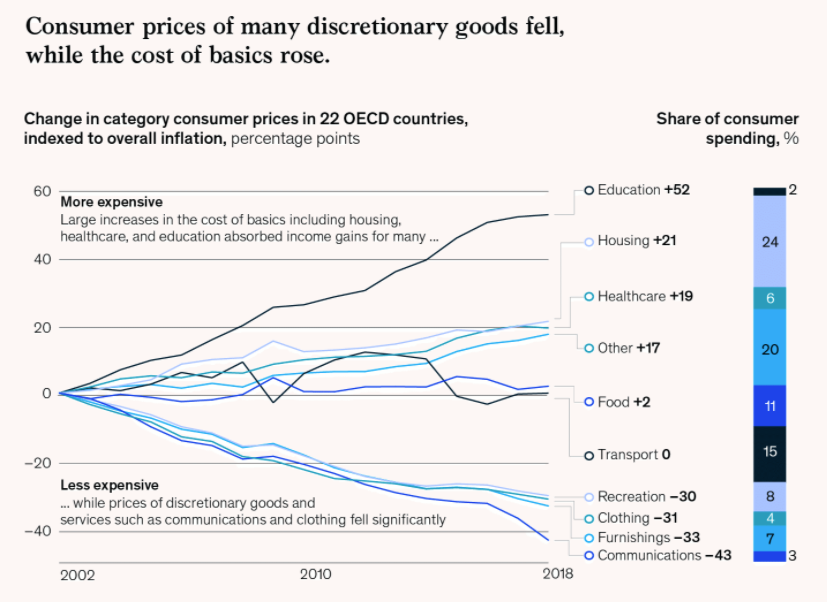
This chart from McKinsey compares cost trends for various products purchased by consumers in the 22 Organization for Economic Cooperation and Development countries. It shows price changes, indexed to inflation, between 2002 and 2018, covering nearly two most-recent decades. 


Here is a Bureau of Labor Statistics analysis of U.S. prices for about the same time period.  It shows that U.S. mobile communications prices have dropped almost identically with the OECD data for communications services. 


That matters since mobile phones are the clear consumer choice for using voice services


source: BLS 


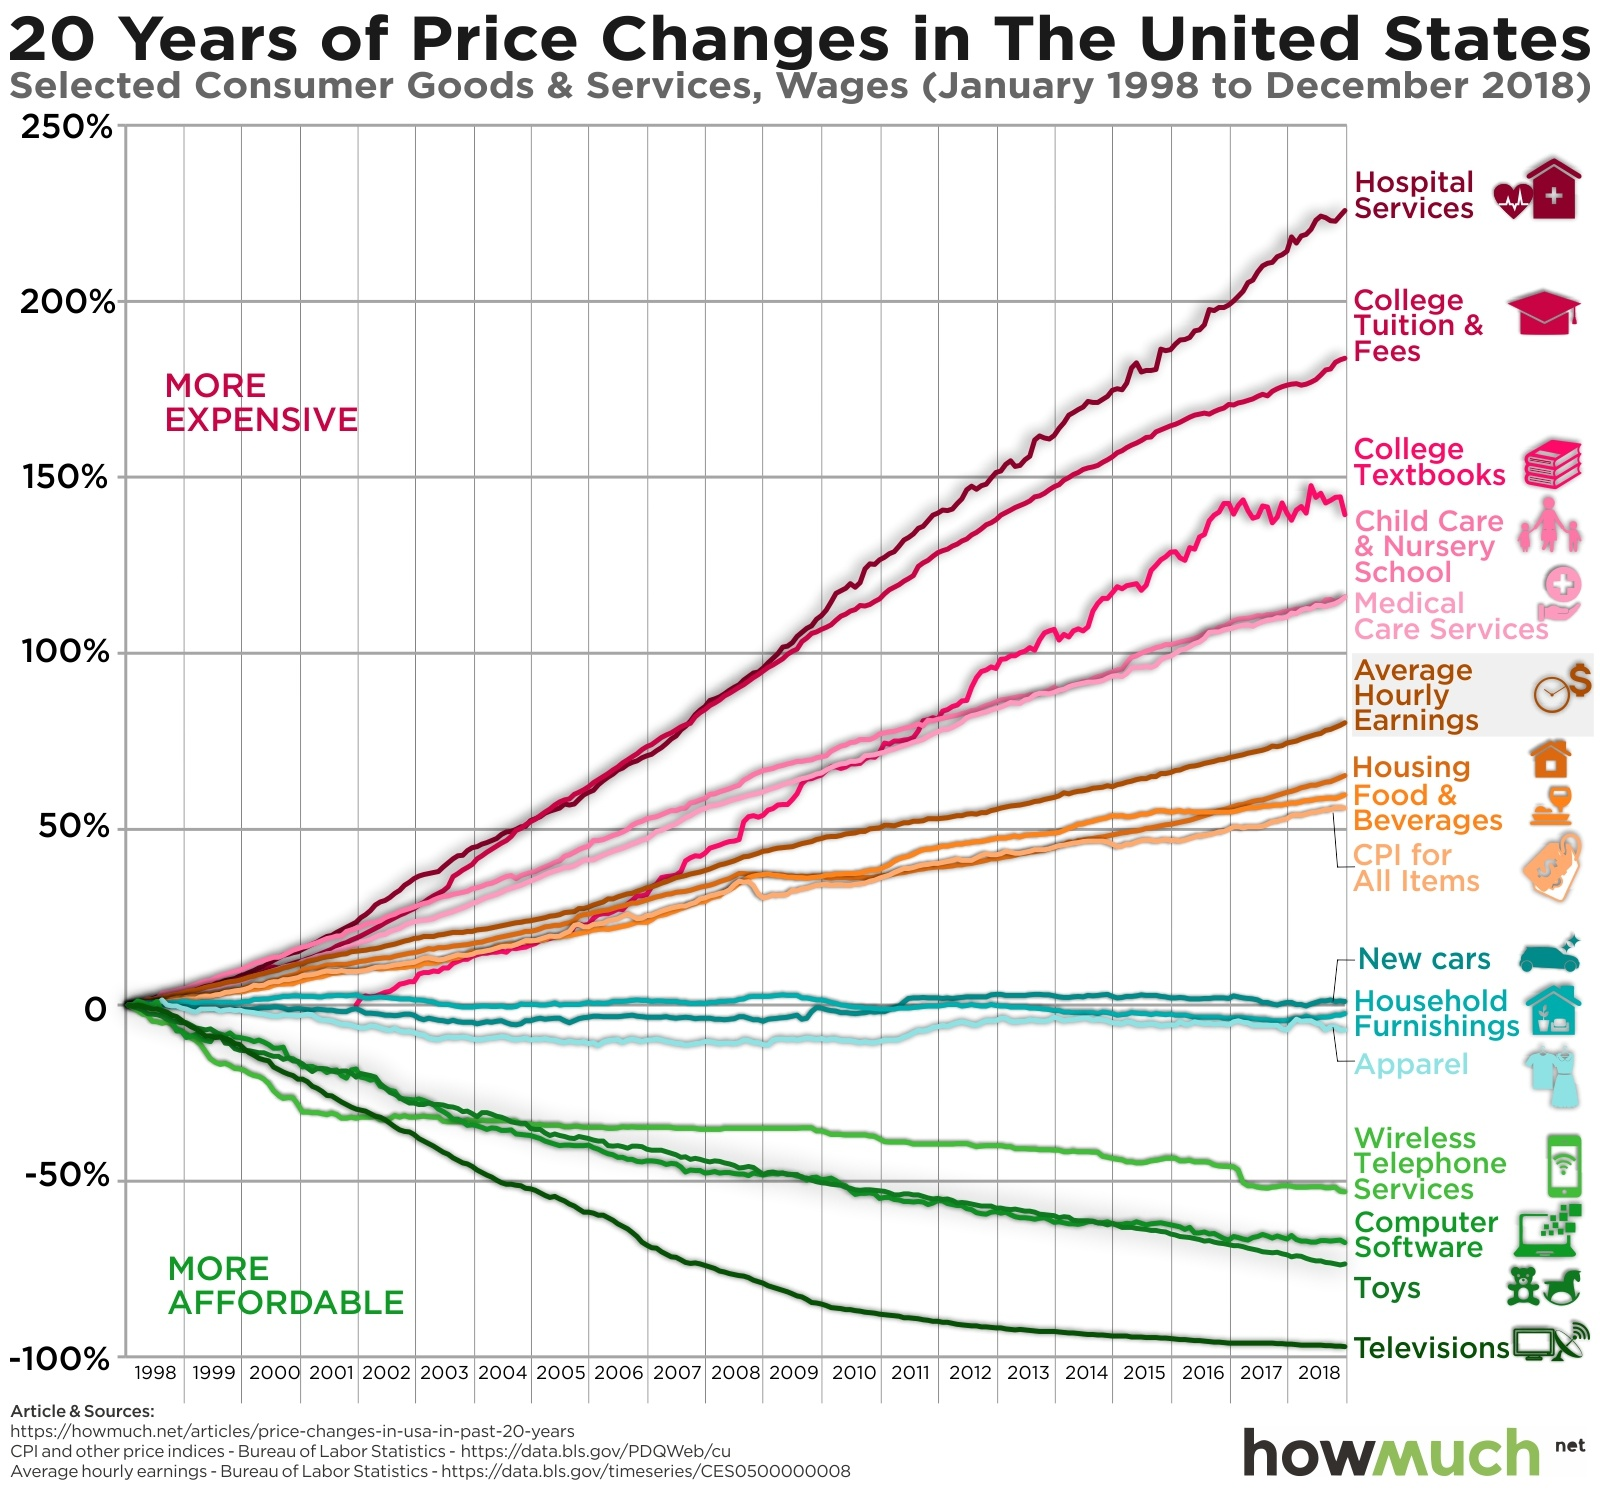
One can see the same general downward price trend for U.S. internet access, normalizing for higher consumption over time. 

source: Strategy Analytics 


Some will argue that is the wrong way to look at consumer internet access prices. Some will point to non-inflation-adjusted retail prices, or note that posted U.S. retail prices are high by global standards. Without adjusting for different costs of living in different countries, one can conclude U.S. Internet prices are too high. 


Adjusting for local prices, as when comparing the cost of an Internet access subscription to national income statistics, yields a different answer, namely that prices are quite low in developed countries. 


Granted, there always are challenges. Rural areas are harder to serve than urban areas. Poorer countries have a harder time supplying access at low prices than richer countries. 


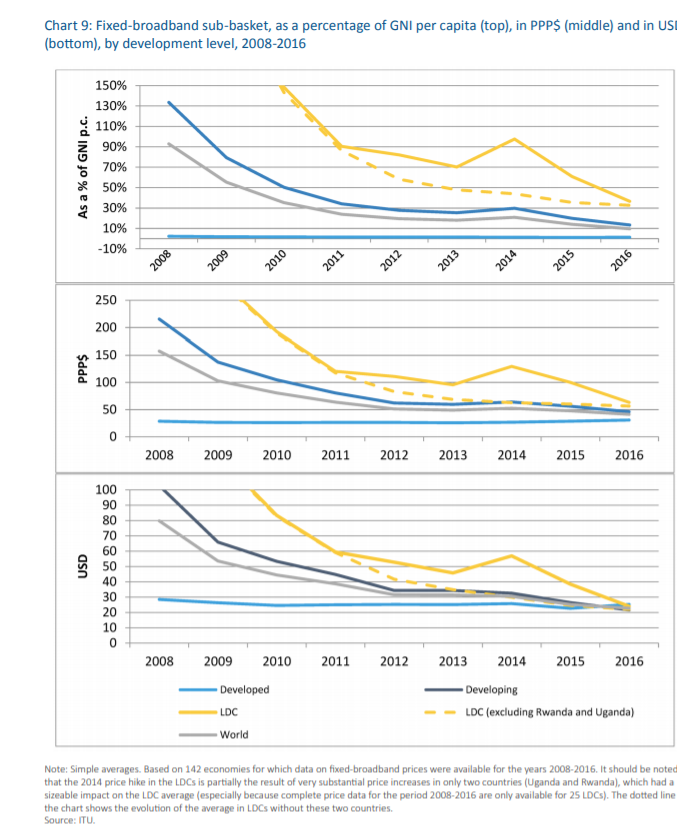
A normalization technique used by the International Telecommunications Union is to attempt to compare prices to gross national income per person, or to adjust posted retail prices using a purchasing power parity method. 


There are methodological issues. Gross national income is not household income, and per-capita measures might not always be the best way to compare prices, income or other metrics. But at a high level, measuring prices as a percentage of income provides some relative measure of affordability. 


Looking at internet access prices using the PPP method, developed nation prices are around $35 to $40 a month. In absolute terms, developed nation prices are less than $30 a month. 

source: ITU


That is worth keeping in mind.


According to BroadbandNow, less than half of U.S. households have access to fixed network internet access at prices of $60 or less per month. The implication is that this is a problem. 


Maybe it is not generally a problem. The average global price of a fixed network internet access connection is $73 a month. So average U.S. prices are significantly lower than the global average.


Tuesday, August 28, 2018

How Much Can the "Median" Household Afford to Spend on Internet, Video, Mobile?

With the caveat that higher-income households might not face so many choices, the cost of linear video subscriptions arguably is a problem for median-income households.


Consider the key issue of ability to pay. There is some evidence that explains why lower-cost streaming alternatives (live TV and non-real time) are growing. Researcher SNL Kagan said in 2015 that DirecTV subscriptions represented as much as 2.4 percent of median household income. That was expected to grow to perhaps three percent of median household income by about 2021.


That is unsustainable, some of us would argue. Increasingly, entertainment video is part of total household spending on mobile communications, internet access and other related services. So the issue is not just how much is spent on video subscriptions, but also how much is spent on communications of all types.

In developed countries, household spending on internet access, for example, is less than two percent, but added to just one linear video subscription could mean that as much as 5.4 percent of household spending is for one video subscription and fixed network internet access.

Then one has to add mobile service, which in a four-person household could be close to $200 a month, or perhaps another five percent of household income. So now more than 10 percent of median household income would possibly be spent on mobility, TV and internet access.

That exceeds what most median households probably could afford to spend (again, with the caveat that higher income households might spend more than that amount).


In 2016, the entire household entertainment budget in the United States was about four percent of average income before taxes in 2016, for example.


According to another estimate, U.S. households spend 5.6 percent of their household income on “entertainment,” but that includes spending on pets, tickets to events, audiovisual equipment such as TVs, hobbies and other services that include video subscriptions. Other U.S. Bureau of Labor Statistics data for 2016 suggest households spend about five percent of income on “entertainment.”


But a study by Pew Research suggested in 2016 that U.S. households spent only about 2.3 percent of income on entertainment.


The implications are clear. Whether you believe a household will spend two percent or five percent of income on entertainment, that budget does not change much. In 1996, Pew researchers say households spend about $1444 on entertainment. In 2016, that amount was $1496. That is the median spending for households with two working parents and two children.


On a per-capita basis, that is only about $374 in 2016, but s single linear video subscription at $80 a month would have represented $960, or 64 percent of the total family budget for all entertainment.


Also, keep in mind that healthcare spending in 2016 was about eight percent per household, according to the Bureau of Labor Statistics.  Even spending on clothing is nearly And recall that pet expenditures also are considered “entertainment.”


If you want to know why a shift to lower-cost video subscriptions is happening, part of the reason is that traditional video subscriptions cost too much, as a percentage of total available entertainment spending.


Still, some 63 percent of U.S. households have both linear TV and at least one streaming service as well, according to Leichtman Research Group. But more change is coming. In the second quarter of 2018, more live streaming accounts were added than linear accounts were lost. In fact, live streaming accounts grew as much as four times faster than linear accounts were lost.


In the second quarter, the major linear service providers lost about 417,000 accounts, while six million to seven million live streaming accounts were added.
In addition to Netflix, Amazon Prime and other streaming services that provide non-real-time content, there is a new class of “live TV” streaming providers that are certain to become more important, as they are an even more-direct replacement for linear (live TV) services.


In the second quarter of 2018, for example, such co-called “virtual multichannel video programming distributors (vMVPDs) added 868,000 net accounts.


The total number of vMVPD accounts then reached 6.73 million, an increase of 119 percent, year over year.


Linear TV accounts (cable, satellite, IPTV, vMVPD) fell to 93.78 million, according to Strategy Analytics.


Thursday, March 15, 2018

U.S. Fixed Network Internet Access Market Reaching Saturation?

Is the U.S. consumer fixed internet access market near saturation? It is quite possible.

By at least one estimate, there are 95 million U.S. buyers of fixed network internet access.


In the fourth quarter of 2017 there were an estimated 136.9 million U.S. housing units. Vacancy rates are an issue, though. Some 16.7 million of those units were vacant.


In the fourth quarter of 2017, some seven percent of rental units were unoccupied, as were some 1.6 percent of owned residences. So assume the number of residences where fixed network consumer telecom services could be sold is about 120.2 million.


So that implies 79 percent of all U.S. households buy a fixed network internet access subscription. Assume another 1.6 million buy a satellite internet access service (about one percent of occupied U.S. residences. That implies 80 percent of occupied homes buy internet access.


But we also must add another six million subscribers served by all the smaller telcos, cable TV companies and independent internet service providers (assuming those smaller fixed network suppliers supply five percent of homes). That adds another five percent, bringing consumer household buying of internet access up to about 85 percent.


Also, some 10 percent of homes use mobile internet access exclusively, according to the Pew Research Center. So add another 12 million occupied U.S. homes to the total of buyers of internet access.


That brings buyers of internet access up to about 95 percent of U.S. occupied homes. The point is that we fast are approaching the point where at-home internet access is saturated. There simply are not that many more U.S. homes to convert, possibly six million or so (unless the percentage of occupied homes grows and millions of new households are formed, driving demand for new housing stock).


In fact, some might argue that as we move into the 5G era, there will be even more mobile substitution. That means it is possible we are very near to the peak of fixed network residential internet access penetration. With the exception of older demographics, home internet access adoption home internet access adoptionhas been flat since about 2010.


Leichtman Research Group reports the 14 largest U.S. cable and telephone providers of internet access  in the United States, representing about 95 percent of the customers--acquired about 2.1 million net additional high-speed Internet subscribers in 2017 (that figure also includes business users).

Broadband Providers
Subscribers at End
of 4Q 2017
Net Adds in
2017
Cable Companies


Comcast
25,869,000
1,168,000
Charter
23,903,000
1,310,000
Altice
4,046,200
83,700
Mediacom
1,209,000
47,000
WOW (WideOpenWest)*
730,000
11,100
Cable ONE**
524,935
11,027
Other Major Private Company^
4,880,000
90,000
Total Top Cable
61,162,135
2,720,827


Phone Companies


AT&T
15,719,000
114,000
Verizon
6,959,000
(79,000)
CenturyLink
5,662,000
(283,000)
Frontier
3,938,000
(333,000)
Windstream
1,006,600
(44,500)
Cincinnati Bell
308,700
5,500
FairPoint^^
301,000
(5,624)
Total Top Telco
33,894,300
(625,624)


Total Top Broadband
95,056,435
2,095,203

The point is that market share shifts are likely to be the key battleground in the consumer fixed network access market, as it appears we are very near saturation, where nearly every customer that wants to buy the product already is a buyer.

Monday, July 29, 2019

What Percentage of U.S. Homes Cannot Buy, or Do Not Buy "Broadband?"

One often has to be careful about statistics related to broadband (25 Mbps or faster) internet access. There are some very common confusions. 

Sometimes the issue of “supply” is conflated with “demand.” It is one thing to say a consumer “cannot buy” a service because it is not available. It is something else to say a consumer chooses not to buy a particular product. 

Sometimes the confusion is definitional. The U.S. Federal Communications Commission defines “broadband” as 25 Mbps, minimum downstream speeds. That is not to say internet access is not available, or purchased. “Broadband” simply means a product offering speeds of at least 25 Mbps.

Such statistics often only refer to terrestrial networks using cables (cable hybrid fiber coax, telco fiber -o-home, fiber to curb or digital subscriber line). Satellite access most often is not enumerated, even when available virtually everywhere in rural areas from two suppliers or more. 

Sometimes one sees a confusion of “people” and “locations.” Homes are one thing, the number of people living in homes is another thing. In the United States, the average number of people in each home is about 2.5 (2.3 by some estimates). Since cabled or fixed internet is sold to “locations,” citing “people” is not as accurate. 

The reverse is true when counting mobile internet access. There, it is “people,” not places, that matter. 

There are a few other nuances. There is a difference between estimated homes and “occupied” homes. And some reported homes are boats, trailers or rooms in houses or apartments. 

With the caveat that I have not read the full report, NPD says in a recent report that 19 million rural residents do not have access to broadband internet. 

If one assumes 2.5 people per household, that in turn implies 7.6 million households that might have internet access, just not at potential speeds of 25 Mbps. NPD also is said to argue that 100 million total people “do not have access to broadband.” 

Since NPD also is reported to argue that “vast majority” of these underserved people are in rural areas, the numbers are off. The most-obvious reason is that reporters are confusing “households” (locations) with “people” (residents of those homes). 

Differences are an issue, but saying X households lack “broadband” is not the same thing as saying X households lack  internet access. Many homes that do not buy “broadband” do have access, just not at 25 Mbps. 

The other obvious qualification is that such data deals only with service purchased from terrestrial providers. 

Virtually all rural households can buy internet access at official “broadband speeds” from at least two satellite internet access providers, at speeds up to 100 Mbps. 

NPD estimates that 31 percent of people do not have broadband service (25 Mbps download speed at a minimum). Qualifications are necessary. Such statements omit service from satellite providers that absolutely meets the broadband definition, and can be purchased by virtually every rural household. 

If the average household has 2.5 people in it, then 100 million people works out to about 40 million households. It is hard to square such numbers with the claim that  the vast majority of underserved households are in rural areas. 

If 7.6 million represents “the vast majority,” it is hard to see how the total universe could be 40 million households. The official press release issued by NPD Group claims 31 percent of U.S. households do not “currently buy” a broadband service, defined as 25 Mbps. 

And the issue of demand cannot be ignored, either. Many households choose--for whatever reasons--not to buy internet access service of any type. That is a demand issue, not a supply issue. 

Gaps exist, to be sure. Up to this point, and possibly always, rural internet access speeds are, on average, slower than found in urban and suburban areas, for reasons directly related to the cost of network infrastructure. So some of the gap is supply related. But not all of the gap is supply constrained; some of the gap is produced by differential demand for the product in urban and rural areas. 

That gap also exists with respect to buy rates. “Rural Americans are now 12 percentage points less likely than Americans overall to have home broadband; in 2007, there was a 16-point gap between rural Americans (35 percent) and all U.S. adults (51 percent) on this question,” according to the Pew Research Center. 


You might think the differences are completely based on the supply of service, but demand also is an issue. 

“Rural residents go online less frequently than their urban and suburban counterparts,” says Pew Research Center. “Roughly three-quarters (76 percent) of adults who live in rural communities say they use the internet on at least a daily basis, compared with more than eight-in-ten of those in suburban (86 percent) or urban (83 percent) areas. 

Some 15 percent of rural adults say they never go online, compared with less than one-in-ten of those who live in urban communities (nine percent) and those who live in the suburbs (six percent). 

The point is that some reports, and news stories about those reports, often are misinterpreted. Fixed internet access is not “all” internet access. “Broadband” is not synonymous with “internet access.” And homes are not the same thing as “people.”

It simply is not believable that “31 percent of U.S. households do not have a broadband connection.”

There are only about 122 million total U.S. households, according to U.S. Census Bureau statistics. That implies 38 million U.S. homes not buying internet access running at a minimum of 25 Mbps.


A more reasonable estimate would be that seven million to possibly nine million locations cannot buy 25 Mbps service from a terrestrial supplier, though virtually 100 percent can buy from at least two satellite providers.

AI Will Improve Productivity, But That is Not the Biggest Possible Change

Many would note that the internet impact on content media has been profound, boosting social and online media at the expense of linear form...