Showing posts sorted by date for query lower ARPU. Sort by relevance Show all posts

Sunday, January 29, 2023

Changes in U.S. FTTH Demand and Supply Sides

There are several reasons--both supply side and demand side--why U.S. “fiber to home” business models appear to have changed. 


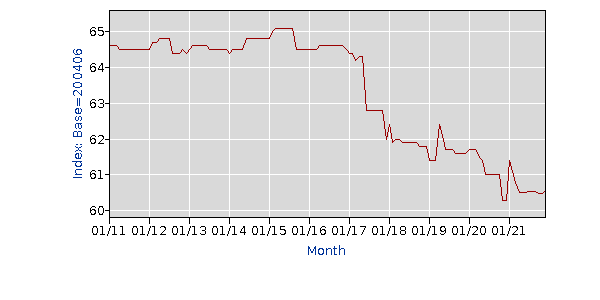
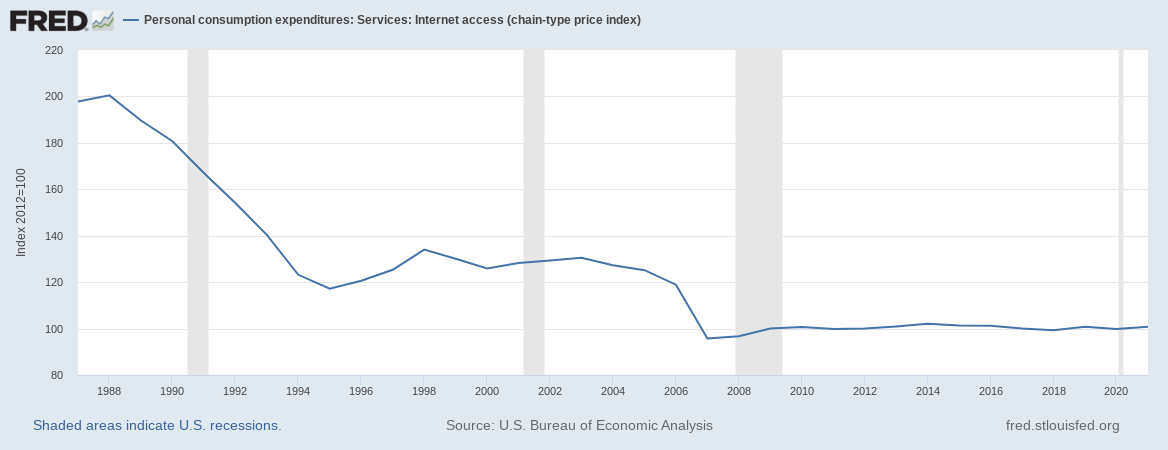
Perhaps oddly, fundamental demand for home broadband, though higher than ever, also provides less of the revenue to build the networks.


As important as the fiber-to-home business is, it is responsible for less than 10 percent of AT&T revenues. In the fourth quarter of 2022, for example, mobility drove nearly 69 percent of total revenue. 


In the fourth quarter of 2022. AT&T earned $31.3 billion. Mobility generated $21.5 billion of that amount. The fixed networks business generated $8.8 billion. Consumer fixed network services generated $3.3 billion or so. 


Of course, not all contestants are similarly situated. For many competitive internet service providers, revenue does largely depend almost exclusively on home broadband. Again oddly, revenue potential for such ISPs also seems to have declined. 


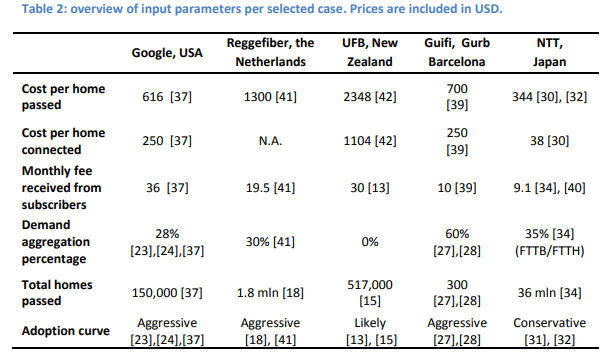
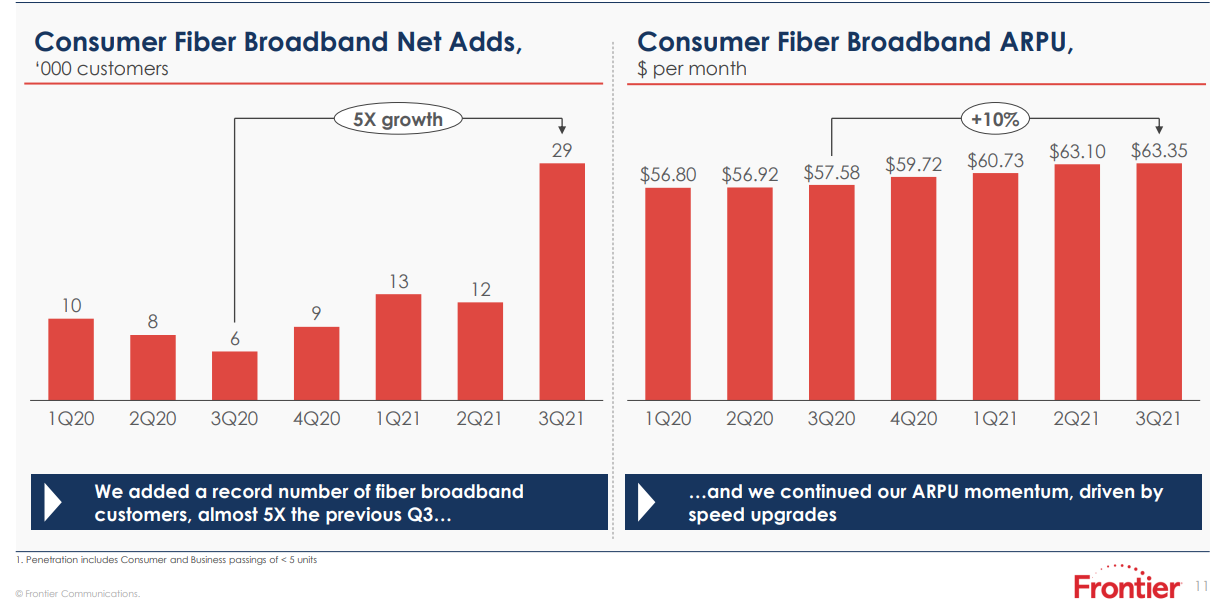
Where designers once assumed FTTH per-customer home revenue in triple digits ($130, for example), they now assume revenue in the $50 to $70 a month range. That might seem to eviscerate the business case, if network costs are in the $800 range with additional costs to connect actual customers in the $600 to $725 range, with take rates ranging from 20 percent up to about 40 percent. 


Only a firm with low overhead can make money sustainably at 20 percent adoption rates. For larger firms, adoption in the 40-percent range is likely required. At a high level, AT&T has been saying FTTH payback models work at $50 a month ARPU and penetration of 50 percent, though revenue from targeted newbuilds now exceed those figures, AT&T says. 


It is one thing for a smaller ISP to contemplate building an FTTH network and sustaining itself solely on such revenues. It is quite another matter for a dominant firm in a local area (Comcast, Charter, AT&T, Verizon, Lumen, Frontier, Brightspeed). 


Strategic concerns also matter, however. Even if the fixed networks business generates 10 percent of total revenue, that revenue still matters. Without the FTTH upgrade, AT&T risks losing that revenue and profit margin and cash flow contribution. 


In other words, even if never stated so starkly, unless the FTTH upgrade is made, AT&T and others risk losing their fixed networks business to competitors. 


At the same time, though harder to quantify, the payback model for deep-fiber networks can come in other ways. If small cell mobile networks require deep fiber networks, then business value comes also from the value of the backhaul network. So “fiber to the tower” and “fiber to the radio site” become elements of the payback model. 


Fiber access networks also support the business customer revenue stream. For AT&T, fourth quarter 2022 fixed networks business revenue was $5.6 billion, or about 18 percent of total revenue. So “fiber to the business” arguably drives almost twice the revenue as home broadband does, for AT&T. 


In other words, the same network supporting home broadband also contributes to support of the mobility business and business customer revenue streams. 


All that makes for a more-complicated payback analysis for any sizable contestant with dominant mobile revenues. Though the home broadband payback has to be there, the value of what we used to call “FTTH” has to be justified in other ways. 


Smaller ISPs might be able to justify an FTTH network on the basis of home broadband services alone, with 20 percent take rates. It is not so clear a large dominant service provider can hope to do so unless it can reach 40 percent or higher take rates, assuming revenue per account in the $50 to $70 range. 


And even when it does so, total deep fiber network value can hinge on other value contributions. 


Still, there are additional considerations. Supply side support from the federal government can reduce the cost of rural networks builds by 20 percent to 30 percent, which aids the payback model. 


Joint ventures of various types provide similar benefits, at the cost of possibly further reducing net revenue upside. 


And though it is an indirect input, many private equity firms are willing to invest in deep fiber projects with a rather simple formula: buy assets at a five times to six times revenue multiple and upgrade with FTTH to produce an asset selling at 10 times to 11 times revenue multiples. 


Demand side drivers also have changed a bit as well, beyond the “need” for internet access. 

The Affordable Connectivity Program provides a $30 a month subsidy for low-income buyers. That subsidy can be used to buy basic or faster services, and increases demand for internet access. 


In some cases, that means new FTTH facilities benefit both from 20 percent to 30 percent lower build costs, plus $30 a month in consumption subsidies for lower-income households. All those are new elements in payback models that improve the business case on both demand and supply sides.


Monday, October 10, 2022

Shocking FTTH Revenue Assumptions

The economics of connectivity provider fiber to the home have always been daunting, but they are, in some ways, more daunting in 2022 than they were a decade ago. The biggest new hurdle is that expected revenue per account metrics have been cut in half or two thirds. That would be daunting for any supplier in any industry. 


These days, the expected revenue contribution from a home broadband account hovers around $50 per month to $70 per month. Some providers might add linear video, voice or text messaging components to a lesser degree. 


But that is a huge change from revenue expectations in the 1990 to 2015 period, when $150 per customer was the possible revenue target.  


You might well question the payback model for new fiber-to-home networks which assume recurring revenue between $50 and $70 per account, per month, with little voice revenue and close to zero video revenue; take rates in the 40-percent range; and network capital investment between $800 and $1000 per passing and connection costs of perhaps $300 per customer. 


But that is the growing reality. Among the reasons: higher government subsidies; indirect revenue contributions and a different investor base. 


All that has shifted fiber-to-home business models in ways that might once have been thought impossible. 


In the face of difficult average revenue per account metrics, co-investment and ancillary revenue contributions have become key. Additional subsidies for home broadband also will reduce FTTH deployment costs. All that matters as revenue expectations are far different from assumptions of two decades ago. 


“Our fiber ARPU was $61.65, up 5.3 percent year over year, with gross addition intake ARPU in the $65 to $70 range,” said John Stankey, AT&T CEO, of second quarter 2022 results. “We expect overall fiber ARPU to continue to improve as more customers roll off promotional pricing and on to simplified pricing constructs.”


Mobility postpaid phone ARPU at AT&T was $54.81. According to some studies, fiber-to-home recurring revenue is lower than that. But AT&T appears to be taking market share from key competitors where it has deployed new FTTH facilities. 


Different investors also are becoming important for access infrastructure. Retail connectivity providers are judged by their ability to generate cash flows, but hampered by the huge capital investments they must make to do so. Institutional investors, on the other hand, have longer payback horizons. They value the predictable cash flow just as much as do telcos, but can afford to be more patient on payback.


Ongoing reductions in operating costs and complexity also play some role in lower breakeven points for connectivity provider access investments. Also, government support mechanisms can reduce deployment costs by as much as 30 percent, in some cases.  


Lumen reports its fiber-to-home average revenue per user at about $58 per month. For those of you who have followed fiber-to-home payback models for any length of time, and especially for those of you who have followed FTTH for many decades, that level of ARPU might come as a shock. 


Though some honest--and typically off the record--evaluations by some telco executives 25 years ago would have predicated the FTTH business model as “you get to keep your business” rather than revenue increases. 


Few financial analysts would have been impressed. 


The theory was that upgrading to FTTH would allow incumbent telcos to essentially trade market share with cable companies: gaining video subscription market share from cable as cable took voice share. The assumption was that home broadband share would remain about where it was. 


The thinking was that per-home revenue could range as high as $130 to $200 per month, even as overall market share was gained by cable and lost by telco providers. 


Econstor


In recent investor presentations, Frontier Communications has made three points about its prospects for revenue growth based on optical fiber deployments: the number of consumer broadband accounts; the number of businesses within 250 feet of existing fiber assets and the number of cell towers within one mile of Frontier fiber assets. 


Recent presentations also have shown fiber-to-home home broadband average revenue per user of about $63. 


source: Frontier Communications 


For at least some observers, the change in FTTH business model assumptions is stunning. Who would have thought FTTH projects would be undertaken when expected revenue per account was $50 to $70 a month?


Friday, July 22, 2022

FTTH ARPU Between $50 and $70 Supports the Payback Model?

You might well question the payback model for new fiber-to-home networks which assume recurring revenue between $50 and $70 per account, per month, with little voice revenue and close to zero video revenue; take rates in the 40-percent range; and network capital investment between $800 and $1000 per passing and connection costs of perhaps $300 per customer. 


But that is the growing reality. Among the reasons: higher government subsidies; indirect revenue contributions and a different investor base. 


All that has shifted fiber-to-home business models in ways that might once have been thought impossible. 


In the face of difficult average revenue per account metrics, co-investment and ancillary revenue contributions have become key. Additional subsidies for home broadband also will reduce FTTH deployment costs. All that matters as revenue expectations are far different from assumptions of two decades ago. 


“Our fiber ARPU was $61.65, up 5.3 percent year over year, with gross addition intake ARPU in the $65 to $70 range,” said John Stankey, AT&T CEO, of second quarter 2022 results. “We expect overall fiber ARPU to continue to improve as more customers roll off promotional pricing and on to simplified pricing constructs.”


Mobility postpaid phone ARPU at AT&T was $54.81. According to some studies, fiber-to-home recurring revenue is lower than that. But AT&T appears to be taking market share from key competitors where it has deployed new FTTH facilities. 


Different investors also are becoming important for access infrastructure. Retail connectivity providers are judged by their ability to generate cash flows, but hampered by the huge capital investments they must make to do so. Institutional investors, on the other hand, have longer payback horizons. They value the predictable cash flow just as much as do telcos, but can afford to be more patient on payback.


Ongoing reductions in operating costs and complexity also play some role in lower breakeven points for connectivity provider access investments. Also, government support mechanisms can reduce deployment costs by as much as 30 percent, in some cases.  


Lumen reports its fiber-to-home average revenue per user at about $58 per month. For those of you who have followed fiber-to-home payback models for any length of time, and especially for those of you who have followed FTTH for many decades, that level of ARPU might come as a shock. 


Though some honest--and typically off the record--evaluations by some telco executives 25 years ago would have predicated the FTTH business model as “you get to keep your business” rather than revenue increases. 


Few financial analysts would have been impressed. 


The theory was that upgrading to FTTH would allow incumbent telcos to essentially trade market share with cable companies: gaining video subscription market share from cable as cable took voice share. The assumption was that home broadband share would remain about where it was. 


The thinking was that per-home revenue could range as high as $130 to $200 per month, even as overall market share was gained by cable and lost by telco providers. 


Econstor


So the business case remains challenging, and especially so in less-dense areas. The main point is that firms deploying fiber to home facilities must do so with radically-reduced expectations for ARPU. 


In recent investor presentations, Frontier Communications has made three points about its prospects for revenue growth based on optical fiber deployments: the number of consumer broadband accounts; the number of businesses within 250 feet of existing fiber assets and the number of cell towers within one mile of Frontier fiber assets. 


Recent presentations also have shown fiber-to-home home broadband average revenue per user of about $63. 


source: Frontier Communications 


Two decades ago, the business model might have assumed far higher revenue per account. A telco or cable TV customer with a voice line generating $30 a month, plus internet plus video could have been worth about $100 a month in revenue. 


Now Frontier says ARPU for an FTTH customer is about $63 a month. Assume that figure includes some amount of voice revenue and zero video revenue. The change in revenue expectation  (not adjusted for inflation) per potential customer is roughly 40 percent lower than might have been the case in 1995. 


Lower-density areas might only be upgraded with fixed wireless, though higher subsidy levels will increase deployment of FTTH in rural and lower-density areas.  


For at least some observers, the change in FTTH business model asumptions is stunning. 


Sunday, April 24, 2022

Is Growth an Unsolvable Problem for Service Providers?

Virtually all observers praise AT&T's "return to connectivity" as the fundamental business strategy. Some hail a new era for the company. Others might point to aggressive marketing tactics that could be hard to sustain longer term, even if they work in the short term.  


But monopoly market dynamics are fundamentally different from those with competition. Slow growth is not a problem for a regulated monopoly that earns a guaranteed--if low--return from investments made with almost zero risk. 


But that same business is fraught with danger in a competitive situation, where profit margins are squeezed; bad investment choices have real consequences and new competitors reduce the effective size of the market any single firm can grab. 


The simplest analogy: in a monopoly market the theoretical share is nearly 100 percent. In a competitive market with two competent suppliers the theoretical market share is 50 percent, In a market with three competent suppliers theoretical market share is reduced to 33 percent of total. 


In practice, a stable competitive market often will have a 4:2:1 pattern of market share among the top-three firms.  


In a mature competitive market it is conceivable that one supplier gets 50 percent share; a second 25 percent; a third 12.5 percent and the rest is divided amongst scores to hundreds of suppliers. But the biggest three suppliers can have close to 90 percent share. 


Few--if any--national communications markets have reached that shape, which suggests the markets remain unstable. 


The access business (voice, internet access, messaging, mobility) has other problems, though. Competition has meant declining profit margins; a lower return on invested capital and, often, lower average revenue per account over time. Revenue growth also is a persistent issue.


And that is the fundamental conundrum big access companies (telcos, cable TV, other ISPs) face. Competitive access markets feature low rates of growth; ARPU pressures; profit pressures and low rates of financial return on invested capital. 


“Sticking to the basics” (connectivity services) was always a low-growth business in the monopoly era. In the competitive era it often is a “close-to-zero growth” or even “negative growth” sort of business. 


That remains a key issue for connectivity providers that “sticking to the core business” does not necessarily solve. Market share gains and losses will remain a key variable under conditions where big gains in ARPU are close to impossible.


Saturday, April 16, 2022

"You Get to Keep Your Business" is the Fundamental Value of FTTH

It now is possible to suggest that a fundamental business problem in the internet era affects both mobile and fixed networks. In both cases, the fundamental issue for connectivity providers is the financial return from network upgrades, whether seen in fiber to the home or 5G and future mobile networks. 


Simply, in a competitive market, capital intensity tends to increase as upgrades to fiber access or mobile networks happen. But revenue does not increase to match. Instead, the pattern is that bandwidth supply grows more exponentially, while customer revenue can grow only linearly, at low single digit rates. 


Higher capital intensity with inelastic revenue growth is therefore the key strategic problem. 


It is a bad scenario, when looked at in traditional financial terms. The capital investments, however, essentially are strategic. Many decades ago, a telco executive facing competition from cable operators concluded that the upside of FTTH was not “more revenue” but “we get to keep our business.”


That is not the sort of analysis a financial analyst would find appealing. 


But that is essentially what upgrades to 5G (and future upgrades) mean. More capital-intensive networks must be deployed to preserve what already exists: the ability to serve customer demand in terms of capacity (gigabytes used) and speed. 


Telco upgrades to FTTH essentially represent the same sort of value: consumer and business account market share is protected from predation and loss to competitors. Spending more money to protect what one already has might not sound like a victory. 


But it is far better than the alternative: continued share loss to competitors and ultimately, a non-viable business model. Sustainability and survival, in other words, is the upside. Revenue growth is nice, but survival is essential. 


The basic issue is that end user demand for data increases almost linearly with time, while the amount of money paid to use networks increases only marginally, if at all, in some cases. 


GlobalData, for example, expects U.S. 5G services will generate average revenue per user of $45.56 during 2022, with 4G generating ARPU of $26.41. 


But matters could change. GlobalData expects that U.S. 5G ARPU will be more than double 4G ARPU in 2023. If that happens, it is almost certainly going to be driven by new use cases and revenue streams such as edge computing, network slicing or content services, we can speculate. 


It is hard to imagine that much growth from consumer data plan price increases. Up to this point, much of the ARPU increase has  been driven by customer upgrades to unlimited usage plans. The obvious problem there is that this is basically a one-time source of revenue lift.


By definition, once a customer plan is upgraded to unlimited usage, usage cannot, itself, drive incremental revenue growth. Price increases largely reflecting inflation adjustments will happen, but beyond that, data usage will not drive ARPU growth. 

source: GlobalData 


Mobile operator executives are right to worry about the financial return from 5G. Those networks are more expensive than 4G. But the alternative is going out of business. 


Traditional financial analysis still matters. Firms will be punished if higher capex results in either the same or lower revenue. But the fundamental problem remains: higher capex now is required to preserve the ability to compete for business.


New revenue and use cases ultimately will be found. But those revenues might only compensate for declines in legacy parts of the business. It is an unappetizing prospect, but a realistic possibility. 


FTTH and 5G succeed if service providers continue to operate and continue to generate profits. For the most part, single-digit revenue increases might be the best outcome. That will not be easy to defend if capex increases more than that. But that is the nature of a connectivity provider’s position in the internet era. 


Bandwidth always must increase. Revenue will grow very slowly. The financial returns from increased capex will be paltry. But firm extinction is the inevitable result, if the investments are not made. 


“You get to stay in business,” like it or not, is the strategic driver of capex. “Higher revenue” is nice if it can be obtained. But it is largely adjustments in other parts of the business model that will help drive such results. 


It is fine to question the 5G or FTTH payback model, and to take other steps to support the business model when those investments are made. But traditional investment criteria will be hard to satisfy, without other adjustments of the payback model.


Friday, February 25, 2022

Revenue, Profit, Investment Issues Dominate Service Provider Strategy in 2022

Much service provider strategy in mobile and fixed network domains is fueled by revenue and profit issues: slow revenue growth; declining legacy revenues; low returns on invested capital with high demands for investment in 5G and home broadband  and constrained free cash flow. 


Probably nobody will be surprised that S&P Global Market Intelligence expects faster connectivity service provider revenue growth in Asia and Latin America and low-single-digit growth in the United States  and Europe in 2022. That has been the trend for a decade or so. 


There are some clear implications, including a shift to non-traditional funding of access networks. 


“We believe telcos worldwide will continue considering alternate means to fund their capex, including network and spectrum sharing (some of which are arguably regulatory driven). A new trend is the possible  trend to create joint ventures to fund access networks, as Virgin Media O2 is considering. 


Investment capital also will be raised by the  sale of non-core legacy, or lower-scaled telecom operations and media assets; and monetization of tower and fiber networks, S&P says. That trend has been underway for a decade. 


In large part, such asset sales are intended to raise capital either for debt reduction or deployment of capital elsewhere in the business. They are advantageous because high capital investment for both fixed network broadband and 5G, plus shareholder payouts will likely constrain discretionary free cash flow available for debt repayment in 2022, S&P says. 


Globally, secular industry declines from legacy products, coupled with significant competition from cable broadband and lost subsidy revenue, will likely constrain fixed network topline revenue growth and profitability. In fact, S&P Global Market Intelligence expects a high-single-digit revenue decline in 2022.


Shrinking and low returns on invested capital remain an issue as well. “The low return on capital across rated telcos has generally been declining, to less than six percent in 2021 from a bit more than seven percent  in 2011, S&P notes. 


That has fueled a search for new revenue sources. Many operators (in Europe) are diversifying from voice and connectivity services to value-added digital services covering a wide range of IT-related, cyber security, IoT, or cloud-based services, S&P notes. 


That move “up the stack” or “across the value chain” is driven by a search for new growth drivers as legacy services become lower-margin products with little--if any--growth potential. 


Also, many operators are seeking to bolster revenue by investing more heavily in fiber-to-home facilities. But monetization of fixed broadband upgrades has been unequal between regions. 


There has been higher revenue growth in the United States than Europe or Latin America, for example. 


5G monetization is uneven between regions as well. Service providers in Asia-Pacific have seen a lift in average revenue per unit (ARPU) from 5G, largely from moving consumers to higher-priced service plans. 


U.S. mobile service provider revenue also grew in 2021, largely by moving customers to higher-priced plans. 


“We expect U.S. wireless service revenue to have increased 3.5 percent to four percent  in 2021, and slowing to around 2% in 2022,” S&P says. 


source: S&P Global Market Intelligence 


Gains are more muted in other regions such as Europe, S&P says. 


In the U.S. market, a key trend is higher investment in fiber-to-home by telcos, which will limit cable operator subscriber growth and market share gains. 


“We expect U.S. telco capital spending to increase to 13 percent to 15 percent in 2022 as carriers deploy spectrum licenses acquired in recent auctions and for FTTH builds,” says S&P. “We expect increased spending to remain elevated over the next couple of years,” largely to support the 5G mid-band networks. 


source: S&P Global Market Intelligence


“We estimate that U.S. telco FTTH coverage will be around 35 percent  in 2022, up from 31 percent in 2021,” the firm says. “We expect FTTH to cover 50 percent to 55 percent of U.S. households by 2028.


“For 2022 and 2023, we expect wireline capex to increase to 10 percent to 15 percent annually, reflecting the accelerated investments in fiber,” S&P says. 


Still, says S&P, “we forecast total U.S. wireline revenue will decline five percent to seven percent in 2022.”


S&P does not believe 5G will drive high revenue growth. “The wireless industry is mature with limited growth opportunities in the traditional retail market.” Though internet of things offers upside, those “IoT opportunities are likely several years away.”


In Europe, the firm  expects revenue growth will be modest, although up from 2021 levels as roaming and equipment sales continue to recover and because of the gradual benefit of accretive fixed-line broadband upgrades. 


Most telecom operators in the Asia-Pacific region  will maintain steady operating performance in 2022, fueled largely by customer data plan spending.


In Latin America, higher growth will be fueled by data demand and 4G, the firm says. 


Many operators are therefore diversifying--mainly through partnership or mergers and acquisitions--from more traditional voice and connectivity services to value-added digital services covering a wide range of IT-related, cyber security, IoT, or cloud-based services. This strategy also seeks to find alternative paths for growth while traditional services are becoming more and more utility-like. 


Saturday, January 29, 2022

Mobile and Internet Access Prices Have Declined in U.S. Since 1997

Many complaints about “high prices” are justified. Most complaints about the cost of mobile or some  fixed network services most often are not justified--costs for linear video subscriptions being the obvious exception to the rule. 


“At a time when seemingly every other industry in America is raising prices, the wireless industry continues to be mired in an interminable ARPU slump,” says Craig Moffett, co-founder of MoffettNathanson.


Here in the U.S. Bureau of Labor Statistics trend on mobile service pricing since 2011. Note that all these prices are below the basis level of 100 in 1997. In other words, since 1997, the cost of mobile service has dropped more than 50 percent


source: BLS


Prices for other consumer services such as internet access also have apparently fallen, even if some reports suggest otherwise. 


Looking at internet access, the U.S. Bureau of Economic Analysis shows a clear decline in costs for internet access between 1988 and 2018, for example. 

source: Bureau of Economic Analysis 


The latest (January 2022) data from the Bureau of Labor Statistics for internet access services shows more than a 60-percent decline in prices since 2004. 

source: Bureau of Labor Statistics 


Data from the U.S. Federal Reserve likewise finds falling prices since 1988. Using a hedonic approach that incorporates improvements in quality, a study prepared for the U.S. Federal Reserve shows a big fall in real prices when “quality of product” changes (including speed) are included in the analysis. 


In other words, even if posted prices seem to be about the same, value is quite a bit higher. In other words, since 1987, value has increased about 20 percent a year while real prices have declined about 20 percent a year. 


source: Federal Reserve 


source: Federal Reserve 


Other analyses also published by the BLS seem to indicate that internet access prices have climbed since 2018. That requires interpretation. 


Here is 2022 BLS data on internet access services and electronic information providers (internet access and other digital services). Prices have climbed since 2018, but are down from the 1997 base level of 100. In other words, prices are about 83 percent of 1997 levels. Some of the increase, we might suggest, is a shift of spending by consumers from lower-priced to higher-priced services.


However, this overstates price changes for consumer internet access, as many other services are included in the analysis that are not “internet access.”


source: BLS


This  BLS analysis includes--in addition to residential internet access--web hosting, domain names, and file hosting for non-business use. 


This category also includes residential, including landline, telephone and TV services bundled with residential internet service, including mobile internet access. Other monthly subscriber fees are included as well, including  internet rental equipment, internet service fees, installation and activation fees, and other associated taxes and fees.


This category does not include any other bundled services such as home monitoring services and wireless telephone service. Fees for online activities such as music or video downloads, streaming media (both music and video), fees for online gaming, and subscriptions to online newspapers or magazines are all excluded.


 Fees to access additional information or services provided by particular websites, such as those offered by popular sporting websites are also excluded. Pre-recorded video on demand subscription streaming services are excluded.


Still, even using this definition, inflation-adjusted prices are 20 percent lower than in 1997


The other caveat is that this data does not clearly separate internet access from price trends for the other information services. Some of us would bet that higher prices for information services are principally driving the price increases since 2018. 


Landline voice services and linear video services, on the other hand, have risen in price since 1997. Cable TV services are about 550 percent higher than 1997 prices. Voice services are close to 140 percent higher than in 1997.   


The bottom line is that prices for mobile service and internet access in the U.S. market have declined since about 1997. They have declined much more if hedonic quality changes are considered.


AI Will Improve Productivity, But That is Not the Biggest Possible Change

Many would note that the internet impact on content media has been profound, boosting social and online media at the expense of linear form...