Tuesday, March 20, 2018

Two Biggest U.S. Voice Providers are Not Telcos

Sign of the times: each of the two largest U.S. cable TV companies now have more voice subscribers than does AT&T, the largest fixed network telco.

In the fourth quarter of 2017, Charter Communications had 10,405,000 residential lines while Comcast had 10,351,000 accounts in service.  AT&T had 10,333,000 lines. So, for the first time, the largest U.S. “telephone companies” were cable TV providers, not telcos.

A key qualification is required, however. Mobile is the way most U.S. residents use voice services. Well over half of U.S. homes (53 percent, according to the U.S. Centers for Disease Control) have no fixed telephone service at all. As recently as 2004, nearly 93 percent of U.S. homes had fixed network voice service.

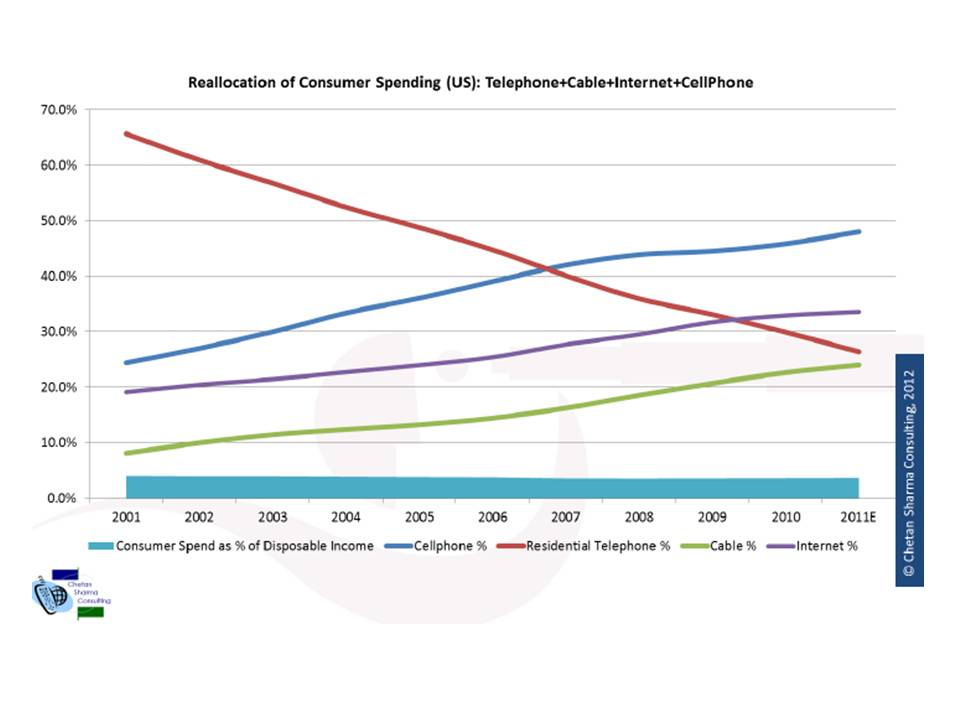
And, as always in the internet era, usage and revenue can be very different matters. In 2011, for example, U.S. consumer spend on fixed network voice had dropped from 65 percent to perhaps 26 percent, compared to 2001 levels, while mobile revenue grew from 25 percent to nearly 50 percent of total household spend, according to analyst Chetan Sharma.

Internet access spending grew from 20 percent of household budgets in 2001 to about 33 percent in 2011, Sharma estimates. Video entertainment spend grew from less than 10 percent of budgets in 2001 to about 24 percent of budget by 2011.


Such is the misfit between our legacy names for things and the new reality. Cable TV companies increasingly make most of their money from internet access, not voice. “Telcos” now likewise make most of their money from internet access, not voice.

Eventually, at least some major service providers will find they make 40 percent or more of total revenue from a range of services not directly related to internet access, voice or messaging. That already is the case for Comcast, and is close to the reality for AT&T, which earns about 31 percent of total revenue from entertainment video.

In fact, Comcast earns only about 29 percent of total revenue from its legacy TV business. Just as important, Comcast now earns about 37 percent of total revenue from applications, not services related to the access network (video, voice, internet access).

Over time, many tier-one service providers are going to have a similar profile, earning 40 percent or more of total revenue directly from applications (consumer and business), not managed services related to the ownership of the access network.

Full Mobile Substitution for Internet Access Coming?

Quite often in business, as well as in physics and the natural world, the equivalent of quantum changes happen. A quantum change is like the change of state of water from ice from solid to liquid, or liquid to gas, gas to liquid or liquid to solid.

The key analogy is that a series of almost-unremarkable quantitative changes accumulate before a nearly-instant change of state happens. A recent example is the change in viewer habits from linear video to on-demand (initially VCR tapes, then DVDs, then streaming) to over-the-top alternatives.

Other examples can be seen in the “long distance” business in the United States. Because of the 1984 breakup of the Bell system, a discrete “long distance” business--separate from the local telephone business-- was created.

Competition--initially from MCI--gradually lead to lower prices overall. Then AT&T launched “Digital One Rate,” which eliminated the price distinction between “local” and “long distance” services, first in the fixed network business and then the mobility business as well.

Over a period of decades, consumer behavior changed, in response. People discovered it made more sense to place outbound “long distance” calls on their mobile phones, since it cost quite a bit less than calling outbound from a fixed network phone, and started calling “long distance” more.

Then, as the price of calling using a mobile also fell, people began abandoning their fixed lines.

The point is that a series of quantitative changes (prices, usage) eventually reach a tipping point, where a qualitative change happens.

The upshot is that we have seen “mobile substitution” happen in waves. First, substitution of mobile for fixed network voice. Then mobile texting as a substitute for voice and email.

Then mobile internet access began to displace fixed network consumption. Now we are seeing quantitative change in entertainment video consumption, from fixed to mobile.

Eventually, those quantitative changes can result in qualitative change, in the same way that earlier transformations have occurred, namely, mobile substitution for fixed.

Though it seems unlikely, based on today’s value proposition (fixed access offers more speed, much-lower prices per bit, higher consumption limits), that value proposition will gradually shift.

We already are seeing the early glimmers of change. Consider the bandwidth issues. Basically, orders of magnitude more usable spectrum, plus lower cell site costs, made possible by new architectures and platforms, accompanied by retail pricing innovations, are narrowing the gap between fixed network internet access and mobile alternatives.

Consider the use of small cells.

In 2017, 62 percent of Verizon’s wireless deployments were small cells. Verizon believes next generation networks will require an order of magnitude (10 times) to two orders of magnitude (100 times) more antenna locations than previous 3G and 4G networks.

AT&T says that the U.S. mobile industry will deploy more small cells in the next three and a half years than the number of macro cells deployed in the last 35 years.

Some argue the industry cannot afford to deploy so many small cells. That ignores the price changes for such cell sites. Where a macrocell might cost $300,000, small cells mountable on light poles, for example, might cost two orders of magnitude less than a macrocell.

Just a few years ago, at lower volume, such small cells might have cost an order of magnitude less than a macrocell, but volume always matters.

So here’s the quantum change possibility: 5G networks will, for the first time, allow consumers to choose a mobile solution for internet access, with no penalty in terms of access speed, usage limits or cost.

“Our research indicates that 5G networks have the potential to leapfrog the capacity of cable operators’ HFC networks,” said Peter Rysavy, Rysavy Research principal. “5G technology is a threat to cable operators” because 5G capacity and performance will meet or exceed that provided by a hybrid fiber coax or even optical fiber connection, in most cases.

Monday, March 19, 2018

Will Artificial Intelligence Create Jobs, Displace Jobs, Recreate Jobs? Yes.

Workplace automation is expected to nearly double in the next three years according to a survey by Willis Towers Watson, with complex impact on jobs and job skills.

While survey respondents report that 12 percent of work is currently being done using AI and robotics versus just seven percent three years ago, they anticipate that this figure will rise to 22 percent in the next three years, the survey suggests.

Though 57 percent of respondents say the key goal of automation is to augment human performance and productivity, it is safe to say nobody can presently predict just how AI is going to wind up driving value.

At the moment, 68 percent of respondents say autonomous operations are not the way they use AI. Rather, 70% use AI and robotics somewhat or to a great extent to support humans in completing business processes.

Some 24 percent of respondents say the goal is to reduce costs. Some 15 percent say AI will provide value by helping firms avoid mistakes.

The report suggests it is a myth that workplace automation will have a largely negative impact on workers and jobs.

Instead, the report argues, the new reality is that automation will result in new combinations of work, talent, skill requirements and work relationships involving a range of workers from full-time equivalent employees to contingents.


The report suggests 27 percent of organizations are redesigning jobs today to require more skills as a result of automation. That percentage is likely to increase to 45 percent over the next three years, the report states.

At the same time, 25 percent of firms are redesigning or will redesign jobs to require fewer skills, increasing and over the next three years to 42 percent.

In other words, applied artificial (or augmented intelligence) will cause job losses, job gains and job changes.

Still, some 49 percent of respondents believe they will require fewer employees in the next three years as a result of automation.

WAN Business in Midst of Huge Product Substitution Trend

Product substitution is among the major underlying trends affecting the global telecommunications business.

Substitution of mobile voice for fixed; mobile internet for fixed; streaming video for linear; over the top apps for managed services; text communications instead of voice and private networking for use of public networks all are examples of the substitution trend.

Consider the wide area networks (WAN) business. In the 21st century, WAN traffic has moved steadily in the direction of carriage on private networks owned and operated by major application providers, and away from the public networks offering internet backbone carriage.

By 2016, more than 70 percent of all internet traffic across the Atlantic was carried over private networks, not on public WAN networks. Obviously, that also means no revenue was earned directly by public service providers for carrying that traffic.

On intra-Asian routes, private networks in 2016 carried 60 percent of all traffic. On trans-Pacific routes, private networks carried about 58 percent of traffic.

In other words, far less traffic now moves over public networks than once was the case, a development with important revenue and business model implications. To a growing extent, private networks are displacing WAN services.  


Friday, March 16, 2018

Premises Phone System Sales Fall 8%

A decline in on-premises private branch exchange (PBX) licenses led the global market to decrease eight percent in 2017 from 2016, to $5.7 billion, according to IHS Markit analyst Diane Myers. Total PBX lines were down nine percent year over year in 2017, with cloud alternatives and buyer caution being key issues.

“Just as we see one area begin to improve, it’s offset by slowdowns in specific geographies or market segments,” Myers said. “Many businesses are holding off on upgrades and new purchases, and the move to cloud services is having an impact.

Although enterprise spending is healthy, businesses are giving low priority to telephony upgrades and expansion on the premises side; PBX average per-line revenue was $167 in 2017, a 1 percent uptick from 2016

Enterprises continue to migrate to IP—to pure IP PBXs in particular—but the segment remains smaller than hybrid systems; hybrid IP PBXs represented 64 percent of all lines shipped in 2017

Demand for unified communications (UC) has been erratic over the past four years, but the segment was in positive territory in 2017, with revenue up five percent from the prior year, IHS Markit says. UC adoption also is growing as more functionality is incorporated into PBX packages.


The IHS Markit quarterly enterprise UC and voice equipment report tracks PBX phone systems (TDM, hybrid and pure IP), UC applications and IP phones.

Have Internet Access Prices Really Grown 25% Since 2010?

“Average fees for standalone broadband have increased nearly 25 percent since 2010,” says a study by Parks Associates on subscription TV and internet access. Other studies have noted higher prices for internet access over the past several years.

That is not the same thing as saying “people are paying more for broadband access.” Sticker or suggested prices are one thing; what customers actually pay can be quite another matter.

That is a major reality of the U.S. internet access market, where most consumer mobile or fixed services accounts are purchased as a bundle, offering discounts over separate purchases of each service. That is why actual internet access prices have dropped over the past couple of decades, despite faster speeds and posted rate hikes.

And make no mistake: bundling as a marketing strategy is designed to increase value and cut prices. In other words, effective prices are cut when consumers buy bundles (dual play, triple play, in some cases quadruple play).  

Also, bundling reduces churn. Some note that average spending by consumers on telco or cable services has risen. That is easy to explain. When consumers buy three or four services, or three or four products, even when getting a discount, average account value grows.

That also is an important point. Higher account spending is not necessarily caused by higher component prices, but because consumers are buying more units.

Mobility shows another trend. The other issue is that account spending can climb because more consumers have moved to “bundled” or “multi-user” or “family” plans, which reduces the total number of accounts, while raising average account spending.

In the U.K. market, 68 percent of fixed network consumers report buy bundles, for example. In the U.S. mobile market, most consumers are on multi-user plans, while in the fixed services market, a similar trend prevails.

In fact, when a consumer buys a bundle, it actually is impossible to determine the precise cost of any single component, except to note that the imputed price of each component comes with a discount.

So it might be much more accurate to say that posted retail prices for internet access have grown. The actual prices consumers pay has almost certainly declined.

Thursday, March 15, 2018

U.S. Fixed Network Internet Access Market Reaching Saturation?

Is the U.S. consumer fixed internet access market near saturation? It is quite possible.

By at least one estimate, there are 95 million U.S. buyers of fixed network internet access.


In the fourth quarter of 2017 there were an estimated 136.9 million U.S. housing units. Vacancy rates are an issue, though. Some 16.7 million of those units were vacant.


In the fourth quarter of 2017, some seven percent of rental units were unoccupied, as were some 1.6 percent of owned residences. So assume the number of residences where fixed network consumer telecom services could be sold is about 120.2 million.


So that implies 79 percent of all U.S. households buy a fixed network internet access subscription. Assume another 1.6 million buy a satellite internet access service (about one percent of occupied U.S. residences. That implies 80 percent of occupied homes buy internet access.


But we also must add another six million subscribers served by all the smaller telcos, cable TV companies and independent internet service providers (assuming those smaller fixed network suppliers supply five percent of homes). That adds another five percent, bringing consumer household buying of internet access up to about 85 percent.


Also, some 10 percent of homes use mobile internet access exclusively, according to the Pew Research Center. So add another 12 million occupied U.S. homes to the total of buyers of internet access.


That brings buyers of internet access up to about 95 percent of U.S. occupied homes. The point is that we fast are approaching the point where at-home internet access is saturated. There simply are not that many more U.S. homes to convert, possibly six million or so (unless the percentage of occupied homes grows and millions of new households are formed, driving demand for new housing stock).


In fact, some might argue that as we move into the 5G era, there will be even more mobile substitution. That means it is possible we are very near to the peak of fixed network residential internet access penetration. With the exception of older demographics, home internet access adoption home internet access adoptionhas been flat since about 2010.


Leichtman Research Group reports the 14 largest U.S. cable and telephone providers of internet access  in the United States, representing about 95 percent of the customers--acquired about 2.1 million net additional high-speed Internet subscribers in 2017 (that figure also includes business users).

Broadband Providers
Subscribers at End
of 4Q 2017
Net Adds in
2017
Cable Companies


Comcast
25,869,000
1,168,000
Charter
23,903,000
1,310,000
Altice
4,046,200
83,700
Mediacom
1,209,000
47,000
WOW (WideOpenWest)*
730,000
11,100
Cable ONE**
524,935
11,027
Other Major Private Company^
4,880,000
90,000
Total Top Cable
61,162,135
2,720,827


Phone Companies


AT&T
15,719,000
114,000
Verizon
6,959,000
(79,000)
CenturyLink
5,662,000
(283,000)
Frontier
3,938,000
(333,000)
Windstream
1,006,600
(44,500)
Cincinnati Bell
308,700
5,500
FairPoint^^
301,000
(5,624)
Total Top Telco
33,894,300
(625,624)


Total Top Broadband
95,056,435
2,095,203

The point is that market share shifts are likely to be the key battleground in the consumer fixed network access market, as it appears we are very near saturation, where nearly every customer that wants to buy the product already is a buyer.

CIOs Believe AI Investments Won't Generate ROI for 2 to 3 Years

According to Lenovo's third annual study of global CIOs surveyed 750 leaders across 10 global markets, CIOs do not expect to see clear a...