Tuesday, April 16, 2019

Malaysia Broadband Faster by 300% in a Year, Prices Down Sharply

In February 2019, Speedtest Global Index by Ookla reported that fixed broadband download speeds in Malaysia increased almost 300 percent to 70.18 Mbps, up from 22.26 Mbps in 2018, the Malaysian Communications and Multimedia Commission says.

Prices are lower by almost half, as well. 

The number of fixed broadband subscriptions with download speeds of more than 100 Mbps also grew by an order of magnitude between 2017 and 2018, the Malaysian Communications and Multimedia Commission reports.

The Mandatory Standard on Access Pricing resulted in dramatically-lower wholesale network pricing,  which allowed the internet service providers in the industry to lower their retail prices as well.

Broadband subscriptions in Malaysia almost doubled over the last five years to reach 39.4 million in 2018.

The upsurge has been mainly triggered by wider access to 3G and 4G/LTE coverage, improved network quality and increased competition in broadband market. As at 31 December 2018, 3G and 4G/LTE network expanded to 94.7 percent and 79.7 percent population coverage, respectively. Meanwhile, High Speed Broadband (HSBB) covered more than 5.5 million premises nationwide as compared with 3.5 million in 2015.
Malaysian Communications and Multimedia Commission


Saturday, April 13, 2019

More Intellligence for Net Operations, Back Office?

Does this sound like your company? A better question: if you are in network operations, information technology, operational support, customer service or some back office role, does this resonate?

Perhaps these are trends that impinge on those sorts of job functions and roles. None of them seem more-broadly top of mind for line of business mangers. 

source: Infiniti Research 

What's Worse: Protecting Producers or Consumers; Business or People?

The scope of antitrust action seems to be a growing issue. Some now argue that dispersing private power should be the main objective; others hold for the current role of protecting consumers. In essence, the issue is whether antitrust is a matter of preventing bigness or preventing consumer harm. They are related, but not identical.

And some propose that multiple purposes be served: protecting privacy, restricting the impact of money in politics, or methods of market oligopoly that are exercised through non-price means.

Some might abbreviate the new approach to a “bigness is bad” framework that assumes consumer welfare is harmed by bigness itself, even if big firms are able to provide greater variety of goods at lower prices (or for free, in the case of ad-supported app platforms and services).

Ignore for the moment that markets lead to concentration precisely because consumers prefer the products supplied by more-successful firms. Ignore the efficiency gains from scale. Ignore the quantifiable reality of lower prices possible precisely because some firms have been able to leverage scale.

The new standards aim to shift the burden of protection from buyers to sellers; from users to suppliers; from price to non-price mechanisms. One might question whether greater reliance on human agency and courts is superior to the action of markets propelled by consumers.

But there cannot be any doubt that protecting suppliers, by restraining bigness, also will introduce greater amounts of human judgment and values into a process that arguably runs better when people are free to vote with their pocketbooks.

That argument might be more true in an era when products are intangible, not tangible, and innovation is very rapid, with few moats to protect inefficient producers. In fact, one might continue to ask why inefficient producers should be protected. “Quality” is usually some major part of the answer some offer. “Local” producers are better than remote producers, even if local producer prices are higher than remote suppliers can offer.

That is part of the charm of local hand-crafted products, for example. Still, restraining price competition will introduce or maintain some amount of inefficiency, and therefore, higher prices. The impact on variety of traded goods will be more varied, but at least some products might not be available if remote and big producers are barred.

Using the consumer welfare standard, action is required only when consumers are harmed, largely by measures of harm from higher prices. Under the “new Brandeis” perspective, bigness alone is sufficient for action, even if consumer prices are lower.

The new Brandeis approach aims to protect suppliers; the consumer welfare framework says it is consumers who need protection. The issue, I suppose is “who do you fear most: big government or big business?

What if Advanced Technology Does Not Matter?

Virtually everyone “believes” (or at least acts as though they believed) that advanced technology (faster broadband, artificial intelligence, IoT, 5G) leads to an increase in productivity. People, organizations, firms and countries that have and use more of such assets are presumed to make faster productivity gains, and generate more economic growth.

The problem, aside from inability to measure precisely, seems to be that the evidence is suspect. It still does not appear that better, faster, more extensive broadband adoption actually is related to productivity gains.


To be sure, productivity measurement always is difficult, in part because there are so many inputs that could contribute. We simply have no way of conducting a controlled experiment.

If there is a direct relationship between broadband and productivity it is hard to measure.


In fact, almost nothing seems to have positively lifted productivity in OECD countries since perhaps 1973.

                                    % growth in GDP/hours worked, 1971–2015


Still, “everyone” acts as though application of advanced technology matters; that better and ubiquitous broadband matters. Perhaps it does. Perhaps productivity would be even lower in the absence of those tools. We simply cannot prove the case.

Friday, April 12, 2019

What HDTV Could Teach Us About Mobile, OTT Video

“People prefer HDTV even when the TV is off,” one executive quipped, in the days before high-definition TV was launched in the U.S. market. What he meant was that the different aspect ratio of the screen (16:9 compared to 4:3) was preferred over the analog TV screen. It is easy to say that people wanted the higher-definition picture, but there were other elements of the experience that also changed at the same time.

The higher resolution is part of the long trend towards more realism in video, to be sure. But higher resolution also meant that pictures looked better on larger screens. So part of the attraction of HDTV was larger screens.

At the same time, the shift to flat screens also had begun, adding a further stylistic change of form factor, and something consumers clearly preferred.

The point is that sometimes consumers desire a product for all kinds of reasons beyond the stated purpose of an innovation.

That is probably good advice when considering more-recent changes, such as the shift to on-demand, non-linear viewing and streaming delivery. People might choose to behave in ways that ultimately may surprise, and not as expected.

For example, most likely believe the story that streaming has value because it provides sufficient choice at lower prices than linear TV. But a new Harris Poll suggests most consumers will eventually spend as much on their streaming subscriptions as they do on linear TV.


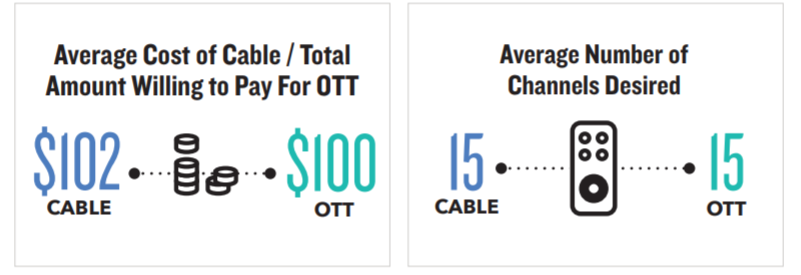
Regardless of whether it is linear subscription TV  or OTT, consumers are consistent in how much they are willing to pay and the amount of content they view. Consumers want about 15 cable channels or OTT services, and are willing to spend $100 per month total, the survey suggests.

The typical U.S. home spent $107 a month on linear subscription TV service in 2018, according to Leichtman Research. And prices for streaming services also are growing. The linear TV replacement services, for example, cost between $40 and $70 a month, with Sling at the low end and DirecTV Now at the high end.

A couple of observations therefore are apt. The AT&T move into linear TV has been criticized as a failure. And some also did not favor its later move into content ownership, either. Some supporters of both moves might say the Harris Poll results tend to confirm that linear video is a springboard to OTT video, and will ultimately be of similar revenue magnitude, even if less of the total revenue might flow to any single former linear video provider.

But the poll results also suggest the shift to skinny linear bundles makes sense, since that approach is best suited to a new market in which overall non-streaming demand falls. But linear streaming formats and on-demand formats will coexist.

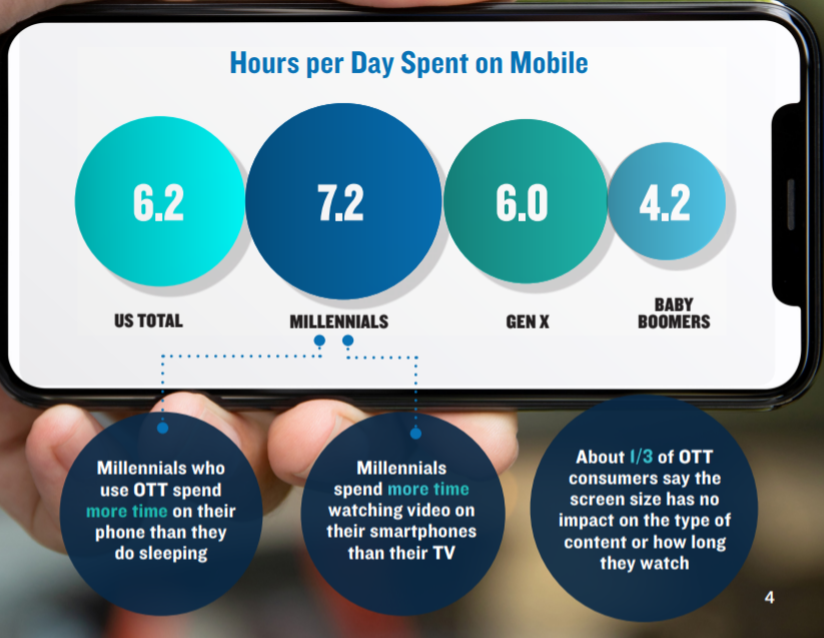
Mobile TV is viewed as a coming evolution of the business as well. Consumers who use at least one OTT service are heavy mobile users, with many saying they are on their smartphone for more than six hours every single day.

Streamers also consume more than 2.5 hours of video content every day on their smartphones, according to the Harris Poll commissioned by OpenX.


What is less clear is how the video subscription business could change as mobile delivery becomes easier, or more popular. Screen size does not seem to be the limitation it once was, as mobility now seems to be valued at least as much as screen size. Unclear are the potential changes in features.

Some might argue that the big change coming with mobile streaming is simply the screen the video is consumed on, namely, the mobile phone instead of the television. So video consumption becomes less place-based (not a fixed TV location).

At least in principle, that creates new opportunities for temporary venue-based video, in some instances. But all that is yet to be developed. Still, it is possible that mobile TV might eventually result in new features for video consumption, as HDTV actually represented several concurrent changes beyond image quality.

Thursday, April 11, 2019

Nine Lies About Work

Half of All U.S. Households are Not Using 25 Mbps Speeds? Impossible

Many complain that Federal Communications Commission data on broadband speeds is incomplete, misleading or wrong. Fair enough. The data will likely never be as good as gathered by Speedtest and other organizations that test actual user sessions, in the concrete. On the other hand, those tests are not “scientific” in the sense of using controlled, weighted samples.

But just a bit of logic suggests many of the complaints about U.S. broadband speeds cannot be correct, either.

Roughly 10 percent of U.S. households are in rural areas, the places where it is most expensive to install fast fixed network internet access facilities, and where the greatest speed gaps--compared to urban areas--almost certainly continue to exist.

In its own work with TV white spaces, Microsoft has targeted perhaps  two million people, or roughly a million households, that have no fixed network internet access. That assumes there are two people living in a typical household, which is below the U.S. average of roughly 2.3 to 2.5 per household.

Recall that the definition of broadband is 25 Mbps downstream. Microsoft has argued that 20 million people (about 10 million homes) or perhaps eight percent of the population (perhaps four percent of homes) cannot get such speeds from any fixed network service provider.

Ignoring for the moment access at such speeds by satellite, fixed wireless or mobile, that is about the dimensions of the potential rural broadband problem. Perhaps nobody would dispute a potential speed gap for those 10 million or so homes.
But Microsoft claims about half of U.S. residents cannot get 25 Mbps service. That is hard to believe. There simply are not enough rural households to create a gap that large when urban and suburban areas, where 92 percent of people live, have access to speeds far higher than 25 Mbps.

In 2018, U.S. fixed internet service provider speeds averaged 96 Mbps downstream, according to Speedtest.


We can freely admit that the FCC data is based on sampling and inferences from that reported data. But we should at least be skeptical, and apply some tests of sanity, when claims of the magnitude of the speed gaps are made. But Ookla’s data is likely quite representative of internet users.

Consider the incentive to test a connection speed. What sort of user is most likely to do so, and when? In my own experience, people test when they suspect a problem, not because they simply want to enjoy how fast their connections are. If anything, the Ookla tests should overemphasize tests by people who suspect they have a problem (slow router, for example).

Personally, I only test when I think I have a problem.

It simply is not mathematically possible for half of U.S. homes to be using less than 25 Mbps when the number of homes in that range are assumed to be rural households, which represent less than 10 percent of total homes.

Even if 100 percent of rural homes could not buy 25 Mbps service, such locations only represent eight percent or so of all locations.

When average speeds are above 100 Mbps nationwide, it is not reasonable to conclude that those eight percent of locations--even if all were using connections slower than 25 Mbps--could represent half of all households.

Microsoft’s claims seem impossible to believe, even if we all agree the FCC data is incomplete or even wrong.

More Computation, Not Data Center Energy Consumption is the Real Issue

Many observers raise key concerns about power consumption of data centers in the era of artificial intelligence.  According to a study by t...