Friday, May 10, 2019

Can Service Providers Boost Consumer Share of Wallet?

Household spending (all other things being equal) is a zero-sum game: when spending in one category rises, spending in others must drop. Spending on communications varies by country.

For connectivity service providers, there are clear implications. To earn more money per account, service providers likely must add new types of products, creating enough value that consumers are willing to buy less of other goods. Shifting demand curves in that manner is quite difficult. It is not impossible, just difficult.

There is, for example, some evidence that households are spending more on communications products(devices plus connectivity and apps) than they used to spend on communications in the past.

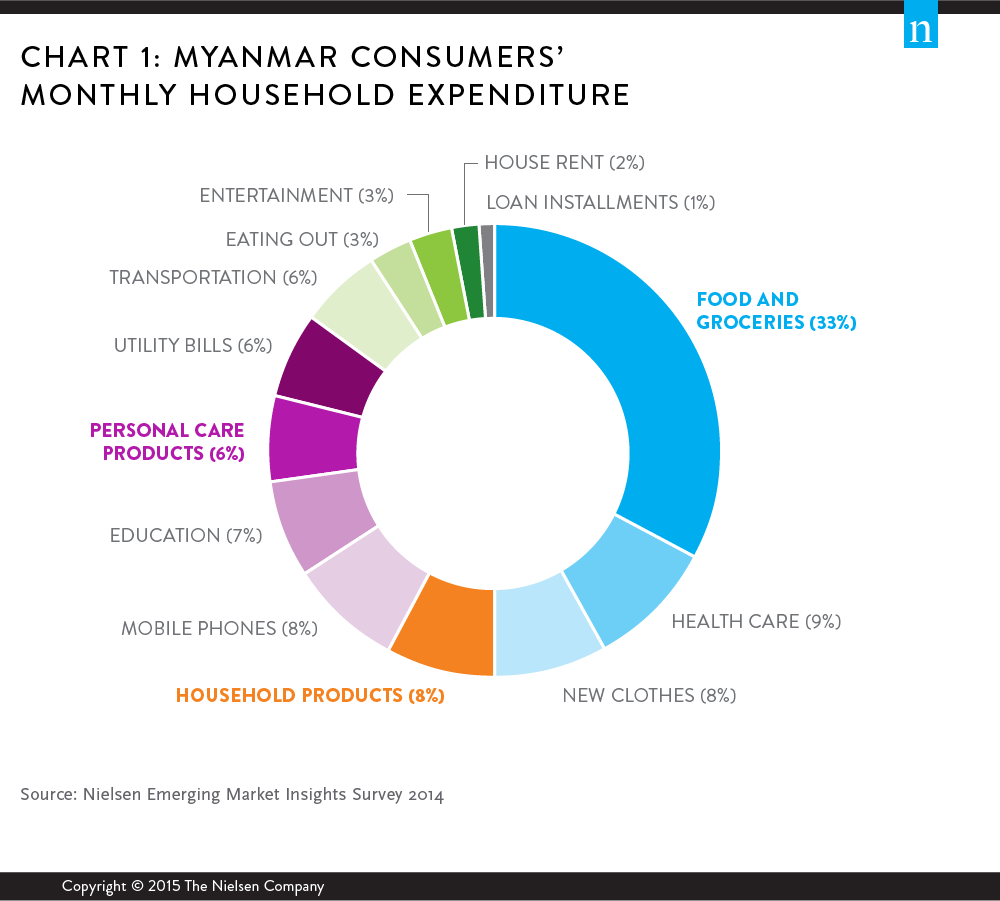
In Myanmar, a new mobile market, spending per household might be as high as eight percent of total spending. In Australia, communications spending (devices and services) might be just 1.5 percent of household spending.  

In South Africa, households spend 3.4 percent of income is spent on communications (devices, software and connectivity). In Vietnam, communications spending is about 1.5 percent of total consumer spending.

In the United States, all communications spending (fixed and mobile, devices, software and connectivity, for all household residents) is perhaps 2.7 percent of total household spending.


Of course, it is entirely possible that “all things are not equal.” Incomes are rising in many parts of the world, creating more discretionary income. Prices for communications products (hardware and software) are changing: rising for top-end devices; dropping for the growing base of affordable devices.

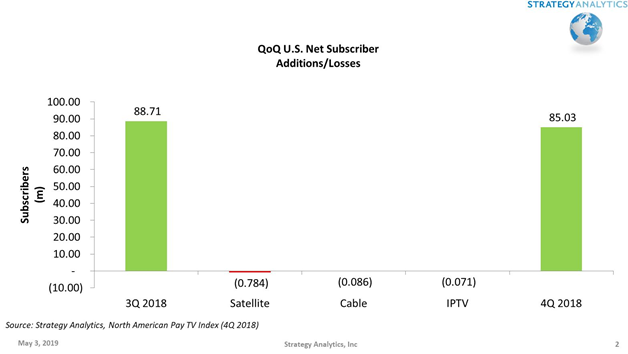
Since subscription TV now is often considered part of the “communications” industry, both connectivity and entertainment revenues have to be considered.

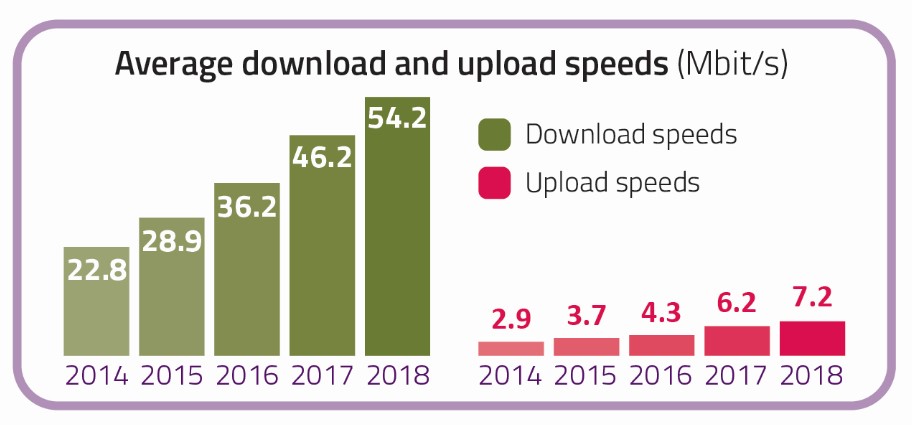
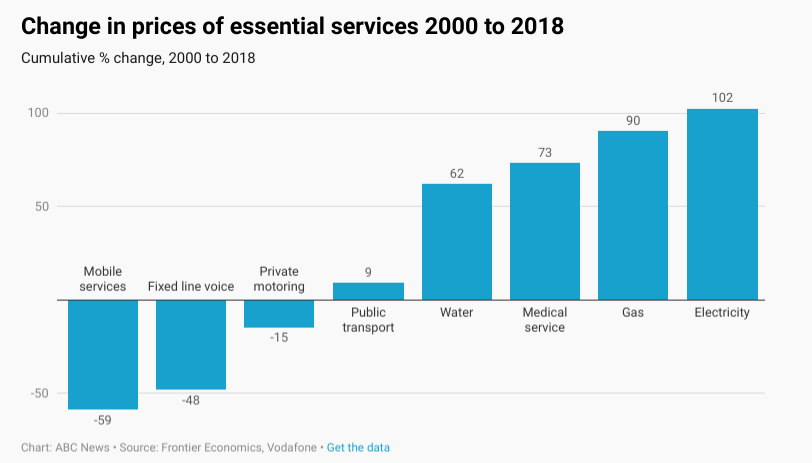
Also, prices for connectivity services are dropping. From 2000 to 2018, mobile and fixed line charges in Europe and other developed markets have dropped.


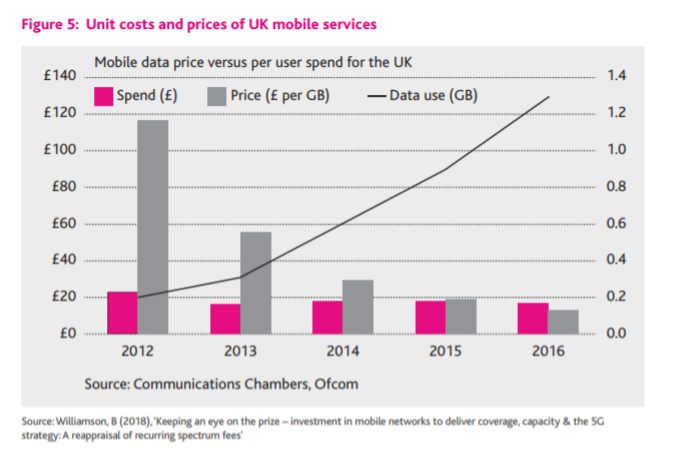
Consumer demand also is shifting. There is less demand for voice and texting services, much more demand for data services. Basically, that has shifted communications spending away from voice and messaging and towards internet access.

Up to a point, we see the same trend in mobile and data access that we earlier saw in long distance services: lower cost per unit but sales of many more units. Still, consumers only have so much money to spend on communications overall.

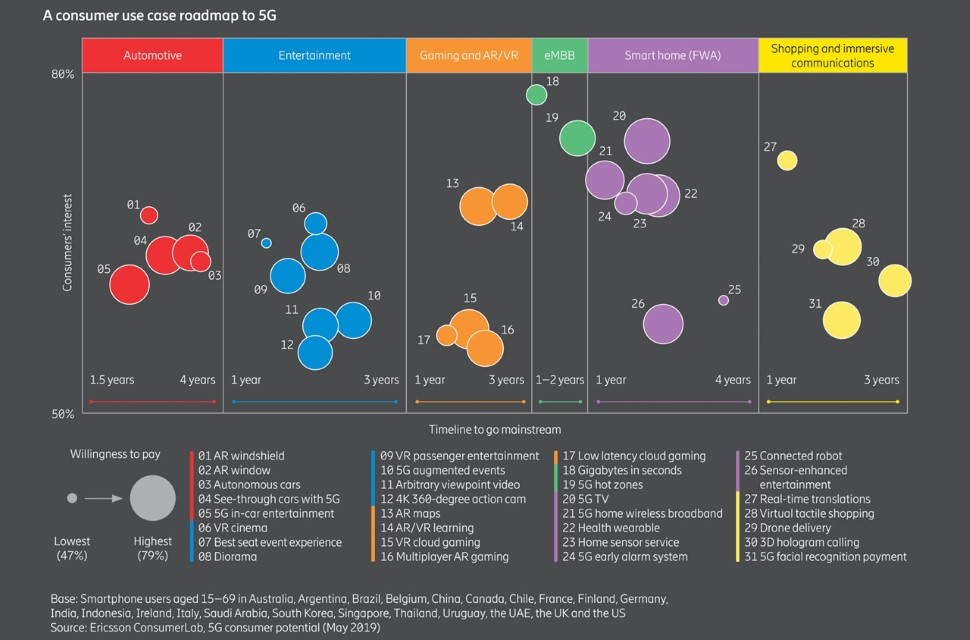
That does not mean the demand cannot be shifted. That is possible, but not easy. One reason service providers look to “move up the stack,” adding more value by occupying new parts of the value chain (applications and services, for example) is that doing so adds new potential revenue sources.

That is one way to shift revenue per account: create conditions where consumers spend more money, on new products, beyond the existing suite of products.

Wednesday, May 8, 2019

Does a Big Expansion of FTTH Make Sense for AT&T?

By some estimates, AT&T passes 55 percent of U.S. homes. Assume total U.S. housing units number 139 million.

Assume a rental vacancy rate of seven percent and a homeowner vacancy rate of 1.4 percent. Assume the percentage of owned housing is 64.2 percent, implying there are 89.2 million owned homes.

In that case, there also are some 35.8 million rental units. That further implies 33.3 million occupied rental units, and some 88 million occupied owned housing units.

Altogether, that implies a total universe of about 121.3 million occupied U.S. housing units. In principle, that means 121.3 milion potential locations a communications service provider might sell services to.

Assume AT&T, passing 55 percent of those locations, therefore could sell fixed service to about 66.7 million locations. That would still be on the high side, as there are some locations--boats, trailers, rented rooms, very-rural locations--that probably are not “sellable” locations. Assume such locations represent one percent of locations, or about 670,000 locations.

So round the addressable base of locations to 66 million.

In its first quarter of 2019, AT&T reported $2.8 billion of internet access revenue, representing about 25 percent of entertainment group revenue of $11.3 billion. AT&T reported 13.8 million broadband accounts in total.

That implies a penetration rate of about 21 percent (so call that the installed base).

AT&T claims 3.1 million “fiber” customers (fiber to the home), with 12.4 million locations passed by FTTH. That implies a take rate of 25 percent, where FTTH is available. Granted, sales should increase over time.

AT&T believes it can boost that take rate to 50 percent over time. Verizon has been able to get a bit more than 40 percent take rates over time, so a 40-percent share target seems reasonable enough.

The issue is what percentage of total passed homes could profitably be upgraded to FTTH.  If AT&T by the end of 2019 has 14 million FTTH homes, that leaves 52 million homes remaining for potential FTTH upgrades.

It is difficult to determine what percentage of those 52 million homes might be amenable for FTTH upgrades. For the sake of argument, assume half those homes actually are in areas dense enough that FTTH is feasible at a cost of about $1,000 per location.

So assume a potential universe of 26 million potential FTTH homes. Assume an actual customer then requires $600 additional cost to activate.

That implies capex of about $26 billion to build the network. Assume AT&T could get 25 percent take rates for the new FTTH services. Here is where it gets tricky. We must assume AT&T already has about 21 percent take rates for internet access already. So what percentage of the new FTTH accounts are incremental, and what percentage are simply upgrades by current customers?

It seems unlikely that AT&T loses many customers by upgrading to FTTH. But that also means a new FTTH network with 25 percent adoption actually represents a net gain of perhaps four percent new accounts.

Even if all the gains at 40-percent adoption are new accounts, AT&T stands to gain about 19 percent new accounts by making the FTTH upgrades. That might represent 4.9 million new accounts.

That implies an investment of nearly $5 billion for customer premises capex. Ignoring time value of money and interest expense, assume capex is at least $31 billion.

Assume “average” internet access revenue of about $130 per quarter, per account, or $43 a month. Assume FTTH boosts average revenue per customer to about $53 a month.

That implies recurring revenue, at 40 percent take rates of about $636 per year, per account. Annual incremental revenue then is about $3.2 billion.

Assume gross margin is about 40 percent. That implies incremental free cash flow of about $1.3 billion annually. So the big question is whether it makes sense to invest $31 billion to earn an additional $1.3 billion in free cash flow.

Smartphone-Only Internet Access Among Low-Income Households Reaches 26%

Some things do not seem to change: in developing or developed nations, lower-income consumers use phones for internet access. Roughly 26 percent of households with income less than $30,000 annually rely on smartphones for internet access, Pew Research Center reports.

Low-income U.S. households are steadily increasing their internet use, but the usage gap between higher-income households and lower-income households remains.


Subsidized service for lower-income households helps. But there still is a correlation between internet use and education, age and geography, not just income.  


U.K. Internet Speeds Climb 20%

New Ofcom research reveals average U.K. broadband speeds have jumped nearly 20 percent over the last year.

Ofcom's annual home broadband performance report shows that, for the first time, the average download speeds people receive has passed the 50 Mbps mark.

Upload speeds, which are increasingly important as more people look to work from home or share videos online, have also increased – up 15 percent to 7.2 Mbps. Both download and upload speeds have more than doubled in the last five years, according to Ofcom.

The fastest speeds recorded in the research were from Virgin Media’s VIVID 350 cable package, with average peak time speeds hitting 360.2 Mbps. BT’s 300 Mbps full-fiber package was second fastest, with an average peak time speed of 300.6 Mbps. This package was top for average peak time upload speeds at 48.8 Mbps, Ofcom says.
In 2018 the average download speed was 54.2 Mbit/s and the average upload speed was 7.2 Mbit/s.


Tuesday, May 7, 2019

Survey Suggests Significant Demand for 5G Fixed Wireless

One question about new 5G revenue sources is whether 5G-based fixed wireless will allow some mobile service providers to take market share from fixed network suppliers. A recent consumer survey by Ericsson suggests there is potential for that happening, even if fixed network suppliers downplay the possibility.

Stated demand for a package of ultra-high-definition TV service (5G TV) bundled with 5G home wireless broadband is most sought after by 74 percent of users in our survey globally.

A similar proportion of smartphone users globally are interested in a 5G hot zone service that offers ultra-high speeds and reliability in demanding locations like airports, shopping streets and office spaces, Ericsson suggests.


As almost always is the case, consumers complain about “high prices” for fixed network internet access. That is the sort of dissatisfaction that some mobile operators believe they can address with fixed wireless alternatives.


Linear Video Providers Lost at Least 1.2 Million Net Accounts in Q1 2019

The leading U.S. linear video subscription providers lost about 1.2 million net accounts in the first quarter of 2019, according to company reports compiled by Fierce Video. The biggest losses were sustained by the satellite providers.

Operators
Video subscribers (mil.)
Net additions (thousands)
1. AT&T*
22.36
(627)
20.85
(121)
15.95
(145)
12.06
(259)
4.4
(53)
6. Altice USA
3.3
(10)

Sunday, May 5, 2019

5G Bad for Satellite TV, China Satellite Communications Exec Says

You might argue that 5G is going to be bad for other contestants in the communications business, ranging from satellite operators and fixed network telecom providers to subscription TV suppliers.

China Satellite Communications Corp., China's largest civilian satellite operator, believes 5G is going to severely erode its satellite TV business.

"The arrival of 5G is bad news  for satellite companies. We have no choice but to diversify our business," said an executive who works for China Satcom.

China Satcom is not alone among satellite firms that earn as much as 60 percent of revenue from television broadcasting.

But the problems include more than 5G, which offers mobile internet speeds fast enough to make serious video consumption possible. As consumption shifts to on-demand modes, point-to-multipoint networks are disadvantaged, compared to point-to-point networks (internet access using symmetrical and cabled facilities).

In some markets, a shift of consumer demand away from broadcast subscription TV and towards on-demand delivery (Netflix, Amazon Prime, Hulu) already is leading to shrinking satellite TV subscriptions. That is why the future of AT&T’s substantial entertainment TV business is on-demand streaming and linear streaming on internet connections.

"Millennials prefer watching TV online, and the only thing that has held them back is a slow internet connection," the executive said. "But that problem will be solved once 5G networks are in place.

Legacy linear TV services (cable, satellite, IPTV) in the U.S. market declined in the fourth quarter of 2018, part of an ongoing trend. Total subscriber losses were about losing 941,000 subscribers (85.03 million accounts remaining).

Satellite services (DirecTV and DISH Network) accounted for 83 percent of the losses.


AI Will Improve Productivity, But That is Not the Biggest Possible Change

Many would note that the internet impact on content media has been profound, boosting social and online media at the expense of linear form...