Thursday, April 9, 2020

Will Canada Telecom Revenue Drop 1% in 2020 Because of Covid?

It might be rational to expect connectivity provider revenue to dip in the wake of the economic shutdowns imposed to combat the Covid-19 pandemic. That might not prove to be the case. 


A better assumption is that markets growing before the pandemic will see reduced growth, but not a dip in growth. Markets that were flat will probably simply remain flat. Markets that were contracting before will contract afterwards. 


That might make sense two years after 2020, some might argue, but will not apply to 2020. After all, the economic impact of efforts to defeat the pandemic will lead to major dips in economic activity and employment. There will be significant numbers of business bankruptcies. All that should reduce aggregate demand for communications services. 


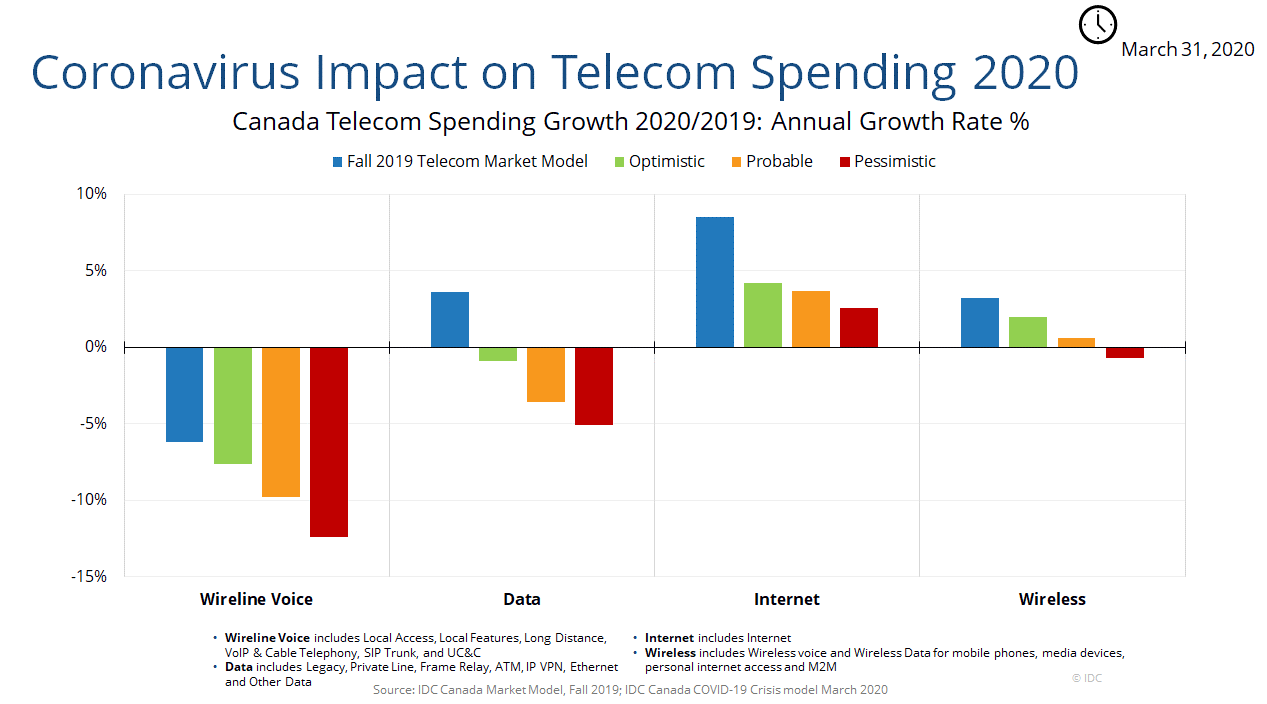
That appears to drive analyst thinking at IDC Canada. Analysts expect that the telecom services market will contract by almost C$2 billion with the overall revenue expected to fall to C$47.9 billion – a negative -0.8 percent decline from a year earlier. 


“As recently as December 2019, we had projected positive 3.2 per cent annual growth for the sector in 2020,” they say. By comparison, IT spending in Canada is expected to decline by negative five percent in 2020, according to IDC Canada's most recent forecast estimate.


The greatest adverse impact on telecom spending forecasts is the projected number of business failures, IDC predicts. The contrary argument would be that communications spending, overall, did not seem to dip in the wake of the great recession of 2008, but only flattened. 

source: IDC 


A dip in revenue might seem the obvious call, as consumption and consumer spending fell virtually across the board in the great recession of 2008, and the virtual shutdown of large parts of the economy in response to the Covid-19 pandemic would seem likely to produce something similar, if not worse. 


But that does not directly translate into consumer, small business and enterprise spending on communication services and products. According to TeleGeography Research, revenue growth  slipped from about seven percent annually to one percent in 2009, returning to about three percent globally in 2011. The recession affected revenue growth, but there was no dip in total revenues, overall


Underlying revenue trends will persist, in other words, within a couple of years after the event. Markets that were growing before will continue to grow. Markets that were contracting will continue to contract. Markets with slightly-positive growth will continue to grow slowly. 


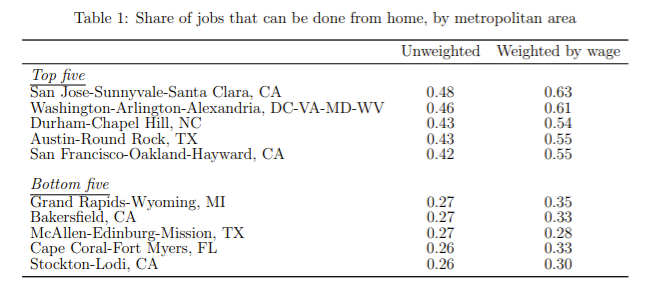
Looking at cash flow earned by Canadian communications firms, total cash flow has been dropping since 2015, according to the Canadian Radio-television and Telecommunications Commission. In terms of revenue, mobile and internet access revenues (not profits, necessarily) have been growing since about 2014, while all other revenue sources have shrunk. 


source: CRTC


One important input for the mobility business that drives overall revenue is the role played by device sales, with a 43 percent compound annual growth rate between 2014 and 2018, while voice and messaging revenues actually had negative rates of growth, with data services, roaming and other sources were up less than six percent. 


Component

2014

2015

2016

2017

2018

Growth (%)

2017-2018

CAGR (%)

2014-2018

Basic voice

8,665.5

8,689.0

8,834.3

9,219.7

7,747.3

-16.0

-2.8

Long-distance

880.4

656.1

547.0

481.9

417.4

-13.4

-17.0

Paging

17.3

12.6

11.1

8.9

9.0

1.1

-15.1

Terminal equipment (including handheld devices)

1,673.7

2,129.8

1,911.1

1,896.1

6,961.9

267.2

42.8

Data

8,672.6

10,034.9

10,980.5

11,832.4

10,857.0

-8.2

5.8

Roaming and other

1,035.7

1,001.9

960.0

1,047.2

1,125.0

7.4

2.1

Data, roaming, and other – subtotal

9,708.3

11,036.8

11,940.4

12,879.6

11,982.0

-7.0

5.4

Total

20,945.2

22,524.3

23,243.9

24,486.2

27,117.7

10.7

6.7

source: CRTC


In other words, perhaps Canada is a market where revenues and profits had been dropping before the impact of Covid-19. A dip in 2020 revenues, as a temporary impact, ignores the preceding trend, which was downward. Again, the point is that the underlying preexisting trend prevails, after the temporary Covid-19 effect in 2020. 


Telecom service provider revenues did not change much in the wake of the great recession of 2008. In fact, according to some studies, U.S. consumer spending on communications actually grew, overall, in the wake of the Great Recession, for example. 


Some surveys found that device purchases slowed during the recession. But some surveys also found consumers willing to make other tradeoffs to keep their broadband, mobile and video subscription services. There was, in other words, less willingness to cut high speed access than other services, for example.


The point is that service provider revenues might not fall, though growth might be reduced to zero. In fact, some studies show that global revenue continued to grow even during the recession of 2008. 


IDC Canada says the fixed network voice, which has been a shrinking market, remains the worst-performing segment under all scenarios because of continued mobile and internet substitution, IDC says. However, long-distance revenue gains might be “major” gains from use of toll-free long-distance conferencing.


Wide area networking services could be affected by business failures, while internet access “will be one of the most insulated markets.” 


Mobile services, which account for almost half of telecom revenue in Canada, remain essential, and likely might see some roaming revenue loss, but not much other downward pressure, the analysts believe.


Wednesday, April 8, 2020

Will 5G Disrupt the Video Subscription Business?

One often hears it said that 5G has potential to affect the video entertainment business. What never seems to be as clear is how that could happen, and where the new sources of value are that could drive the trend. Quibi has one answer, namely mobile-optimized short-form content.


The suggestion is that subscription mobile video services could emerge that are delivered exclusively using the 5G network, much as cable TV is delivered using the hybrid fiber coax network. That logically applies most immediately to linear content formats, as the whole premise of any on-demand over-the-top subscription is that the access network really does not matter. 


The thinking seems to be that 5G enables mobile-centric video subscriptions that could, in some cases, displace traditional linear formats such as cable TV, satellite TV or over the air broadcasting. 


Some might suggest artificial reality and virtual reality could be additional angles, though many might also suggest this is more likely to shape video games than entertainment video in the near term. 


Many sort of vaguely say mobility, internet access and video could be disrupted, but are not too specific about those changes. 


Sometimes the threat is fixed wireless competition for cable modem services, which might affect cable operators, but not directly cable operator video revenues. 


Yet others might suggest it is the ability to use 5G networks to cast content from mobiles to TV and other screens, which is not so much a format change as a delivery change. 


The point is that it remains somewhat unclear at the moment how big 5G-delivered video services might become. Mobile-optimized services (aspect ratio and short form, for example) are one angle. Bundled linear or on-demand subscriptions (5G access plus the app) are another angle. New formats using AR or VR and displayed on the mobile or some other device provide another avenue. 


As a practical matter, much of the early activity is likely to involve ways to use the 5G network as the access pipe, instead of using some cabled network. Quibi seems to be among the earliest efforts to create mobile-optimized content. But most linear or on-demand approaches are mostly going to use 5G as an alternate access pipe.


Tuesday, April 7, 2020

What Lasting Changes for Telecom after Pandemic?

Perhaps the biggest story in telecom is the way global networks are handling an unexpected jump in usage caused by stay-at-home policies. Vodafone data traffic is up 50 percent in some markets. Telecom Italia fixed-line network data volume seems to be up more than 90 percent and mobile data has grown more than 30 percent since the country went into lockdown. BT says its U.K. daytime traffic has ballooned as much as 60 percent. 


The sudden adoption of “stay at home” policies in many countries will provide a “stress test” for communications networks at the same time, revealing which networks are resilient, and which are less so. So far, there are few reports of problems, though perhaps it is inevitable that speculation about breaking the internet will prove irresistible storylines


The real story is the absence of reports about actual service degradation. The enduring story, arfter the pandemic ends, is how brief the impact on the telecom business turns out to have had, and how consistent revenues will be, pre-pandemic and post-pandemic. To be sure, traffic up, virtually across the board, right now.


Verizon reported that between March 12 and March 19, 2020, total voice usage on Verizon networks was up 25 percent, with the primary driver being use of conference call services.


Cisco reports that traffic on the Webex backbone connecting China-based Webex users to their global workplaces has increased as much as 22 times since the Covid-19 outbreak began. During the same time period, Webex also saw four to five times as many users in Japan, South Korea and Singapore, with the average time spent on Webex video meetings doubling among users in those countries.


Mobile voice usage was up 10 percent, while call duration was up 15 percent. Presumably much of that is related to the use of conference calling services. Still, voice traffic requires so little bandwidth that none of that would affect user experience overall. 


Virtual private network traffic was up 25 percent and web traffic was up 22 percent. 


On March 19, OpenVault reported that data usage during business hours grew more than 41 percent. Average usage during the 9 am-to-5 pm daypart has risen to 6.3 GB, 41.4 percent higher than the January figure of 4.4 GB. 


But the pandemic will end. Students will go back to school, employees will go back to work. Stores, offices, airports and factories will reopen.


It would be logical indeed to speculate on what lasting impact there might be for connectivity service providers. The answer, paradoxically, might be “not so much,” over the longer term. Economies will return to working from the office, the factory, the airport, the docks, the railroads, retail stores, hotels and movie theaters. 


Yes, there will be some increasing remote work, perhaps changes in workplace densities and other social distancing policies that are relatively important for a few years. But connectivity spending is remarkably consistent, across consumer and business segments. A case in point is what will happen near term, in 2020, as a result of all the stay-at-home restrictions. 


Worldwide IT spending is now expected to decline 2.7 percent in constant currency terms in 2020, IDC now predicts. Spending on communications services will be flat, which might be deemed a relative relief for connectivity service providers. 


% Year Over Year Growth

2019

2020

2021

IT Spending

+4.8%

-2.7%

+4.9%

Telecom Spending

+1.0%

+0.5%

+1.0%

ICT Spending

+3.5%

-1.6%

+3.4%

source: IDC


The big takeaway there is how little change might happen, in terms of revenue. 

Monday, April 6, 2020

IDC Revises IT Spending Forecast Downward, But Telecom Spending Should Grow Slightly in 2020

Worldwide IT spending is now expected to decline 2.7 percent in constant currency terms in 2020, IDC now predicts. Spending on communications services will be flat, which might be deemed a relative relief for connectivity service providers. 


% Year Over Year Growth

2019

2020

2021

IT Spending

+4.8%

-2.7%

+4.9%

Telecom Spending

+1.0%

+0.5%

+1.0%

ICT Spending

+3.5%

-1.6%

+3.4%

source: IDC


This is the third forecast in as many months by IDC, as analysts have had to adjust expectations based on the roiling impact of the Covid-19 pandemic and what IDC is hearing from enterprise IT buyers, in all likelihood. 


% Growth 2020

January Forecast

February Forecast

March Forecast

Real GDP

+2.4%

+2.0%

-1.7%

IT Spending

+5.1%

+4.3%

-2.7%

source: IDC


“Overall IT spending will decline in 2020, despite increased demand and usage for some technologies and services by individual companies and consumers,” Stephen Minton, IDC program VP.


% Year Over Year Growth

2019

2020

Devices

+0.9%

-8.8%

Infrastructure

+8.8%

+5.3%

Software

+10.0%

+1.7%

IT Services

+3.9%

-2.0%

IT Spending

+4.8%

-2.7%

source: IDC


In the January forecast, Minton and his team were expecting real gross domestic product to grow by 2.4 percent and IT spending to rise by 5.1 percent. At the end of March analysts had revised their thinking on global GDP. The January forecast was that GDP would grow, as would IT spending.


Roughly a Third of U.S. Jobs Could be Done Remote, Study Suggests

There always is a difference between what is possible and what happens. The same might be said of work-from-home potential, conducted by professors  Jonathan Dingel and Brent Neiman of the University of Chicago Booth School of Business. 


The study suggest 34 percent of U.S. jobs can plausibly be performed at home. Assuming all occupations involve the same hours of work, these jobs account for 44 percent of all wages. The converse is that 66 percent of jobs cannot plausibly be shifted to “at home” mode. 


As you might guess, some jobs and some areas are more amenable to remote work. The top five U.S. metro areas feature many jobs in government or technology that could be done from home. On the other hand, some areas involve manufacturing, agriculture, raw materials extraction of other major industries that are not amenable to remote work. 

source: Dingel and Neiman


“More than 40 percent of jobs in San Francisco, San Jose, and Washington, DC could be performed at home, whereas this is the case for fewer than 30 percent of jobs in Fort Myers, Grand Rapids, or Las Vegas,” they say. 


Professional, scientific and technical services, management jobs, education, finance, insurance and information jobs are easiest to shift to remote work. Transportation, warehouse operations, construction, retail, agriculture, food services and lodging are among the hardest to shift to remote work. 

source: Dingel and Neiman


The issue is how comfortable more employers will be with remote work. Employees overwhelmingly want the option to work at least some of the time from home. But some employees might not enjoy the experience and might worry about the “out of sight, out of mind” risk.


Many employers also worry about the impact on productivity, in some cases. 

source: Buffer


Mutual trust is at the heart of successful remote work initiatives in the digital workplace, Gartner emphasizes.


Application leaders must trust that their employees will act responsibly when working remotely. As a practical matter, some workers thrive working remotely, while others will feel isolated. Some workers manage their time more successfully than others. 


Also, “employees must trust that their employer will act in their best interest and enable them to be successful,” Gartner notes. 


The bottom line is that even when it is possible for many more people to work remotely, especially on a full-time basis, actual deployments will lag potential.


The Power of the S Curve for Every Business

This graph illustrates the normal S curve curve of consumer or business adoption of virtually any successful product, as well as the need to create the next generation of product before the legacy product reaches its peak and then begins its decline. 


The curves show that 4G is created and then is commercialized before 3G reaches its peak, and then declines, as the new product displaces demand for the old.  The data, from the Global Mobile Suppliers Association, shows that by the end of 2014, 3G reached its peak. 

source: GSA


The 4G network reaches an inflection point at about the same time. If one examines each curve separately, successive S curves are the pattern. A firm or an industry has to begin work on the next generation of products while existing products are still near peak levels. 


source: Strategic Thinker


It also can take decades before a successful innovation actually reaches commercialization. The next big thing will have first been talked about roughly 30 years ago, says technologist Greg Satell. IBM coined the term machine learning in 1959, for example.


The S curve describes the way new technologies are adopted. It is related to the product life cycle. Many times, reaping the full benefits of a major new technology can take 20 to 30 years. Alexander Fleming discovered penicillin in 1928, it didn’t arrive on the market until 1945, nearly 20 years later.


Electricity did not have a measurable impact on the economy until the early 1920s, 40 years after Edison’s plant, it can be argued.


It wasn’t until the late 1990’s, or about 30 years after 1968, that computers had a measurable effect on the US economy, many would note.


source: Wikipedia


The point is that the next big thing will turn out to be an idea first broached decades ago, even if it has not been possible to commercialize that idea. 


The even-bigger idea is that all firms and industries must work to create the next generation of products before the existing products reach saturation. That is why work already has begun on 6G, even as 5G is just being commercialized. Generally, the next-generation mobile network is introduced every decade. 


Sunday, April 5, 2020

Australia NBN Data Traffic Up 70%

NBN data traffic is up 70 per cent during the business hours, according to the Australian Competition and Consumer Commission, while mobile call volumes are up 50 percent on some routes. 


But the stay-at-home shift is not “breaking the internet." The sudden adoption of “stay at home” policies in many countries will provide a “stress test” for communications networks at the same time, revealing which networks are resilient, and which are less so. So far, there are few reports of problems, though perhaps it is inevitable that speculation about breaking the internet will prove irresistible storylines


The real story is the absence of reports about actual service degradation. A few service providers already have released data on the spike in usage.


Verizon reported that between March 12 and March 19, 2020, total voice usage on Verizon networks was up 25 percent, with the primary driver being use of conference call services.


Cisco reports that traffic on the Webex backbone connecting China-based Webex users to their global workplaces has increased as much as 22 times since the Covid-19 outbreak began. During the same time period, Webex also saw four to five times as many users in Japan, South Korea and Singapore, with the average time spent on Webex video meetings doubling among users in those countries.


Mobile voice usage was up 10 percent, while call duration was up 15 percent. Presumably much of that is related to the use of conference calling services. Still, voice traffic requires so little bandwidth that none of that would affect user experience overall. 


Virtual private network traffic was up 25 percent and web traffic was up 22 percent. 


With so many people now working at home, with schools closed, entertainment video and game play bandwidth consumption are new concerns for internet service and app providers. Some note that it is streaming video that represents the single biggest source of new demand on access networks. 


Streaming Netflix at high-definition settings uses up to 3000 MB per hour. Netflix in 4K will use even more. A virtual Zoom meeting, using 1080p settings consumes 1.8 Mbps, or about 810 MB per hour. 


Fortnite and Minecraft both reportedly use about 100 megabytes of data per hour, according to Chris Hoffman, How-To Geek editor. Most games likely consume 40 MB to 150 MB per hour. 


Perhaps some are surprised that global networks are holding up so well under the sudden additional load. That is testament to the investments internet service providers, cloud data centers and capacity suppliers have made over the past couple of decades.


How Much Revenue Do AWS, Azure, Google Cloud Make from AI?

Aside from Nvidia, perhaps only the hyperscale cloud computing as a service suppliers already are making money from artificial intelligence ...