Tuesday, October 6, 2020

What are Cash Flow Implications of an AT&T Sale of DirecTV?

One question some of us have about any sale by AT&T of its DirecTV asset is the impact on free cash flow, which might have been as much as 13 percent of total cash flow, or possibly more, by some accounts 


In late 2019 DirecTV was said to be spinning off about $4 billion in annual cash flow, which seems low to me, but appears to be about right. In the first full year of ownership, DirecTV likely produced $12 billion of free cash flow.


Some speculate that AT&T could retain a minority interest in the business, and some of the cash flow. The point is that the cash flow implications of selling DirecTV are far less than would have been the case five years ago, when it appears the cash flow was three times higher.


Aside from the need for high cash flow to help pay down debt, the company also requires high cash flow to pay its dividends. Though not a popular position, the DirecTV acquisition made sense to me as the only viable way to add so much cash flow so fast. 


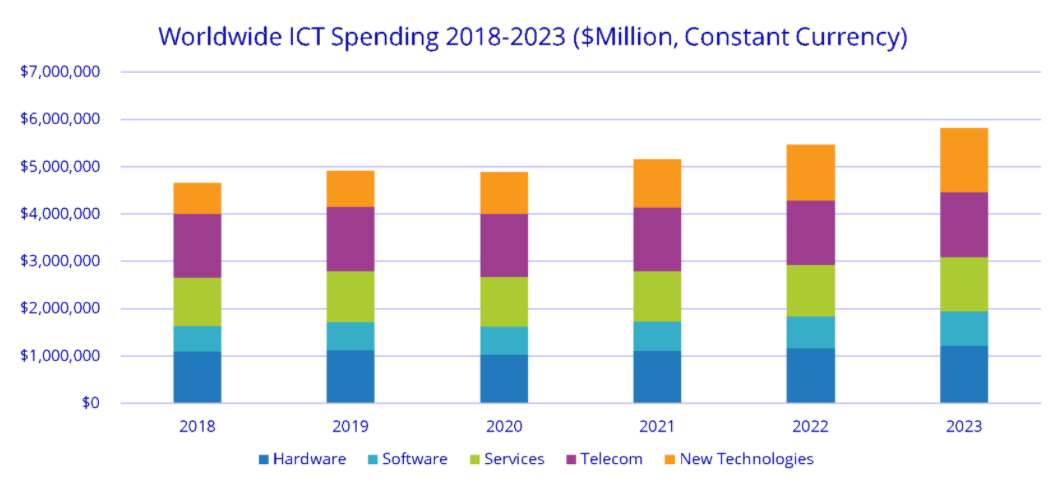
Some had suggested the alternative of investing the capital in fiber to home facilities, but I never understood how cash flow could be boosted fast enough that way. Some might argue a massive diversion of capital to FTTH would not have recovered cost of capital, much less begun generating significant new cash flows within a year. 


When DirecTV was acquired by AT&T, it would have been easy to find detractors arguing that AT&T should have spent that money investing in fiber to home infrastructure. The new story is hat AT&T should not have done so, as the asset is wasting away. 


So what should AT&T have done with $67 billion, assuming a 4.6 percent cost of capital? Cost of capital is the annualized return a borrower or equity issuer (paying a dividend) incurs simply to cover the cost of borrowing.


In AT&T’s case, the breakeven rate is 4.6 percent, which is the cost of borrowing itself. To earn an actual return, AT&T has to generate new revenue above 4.6 percent.


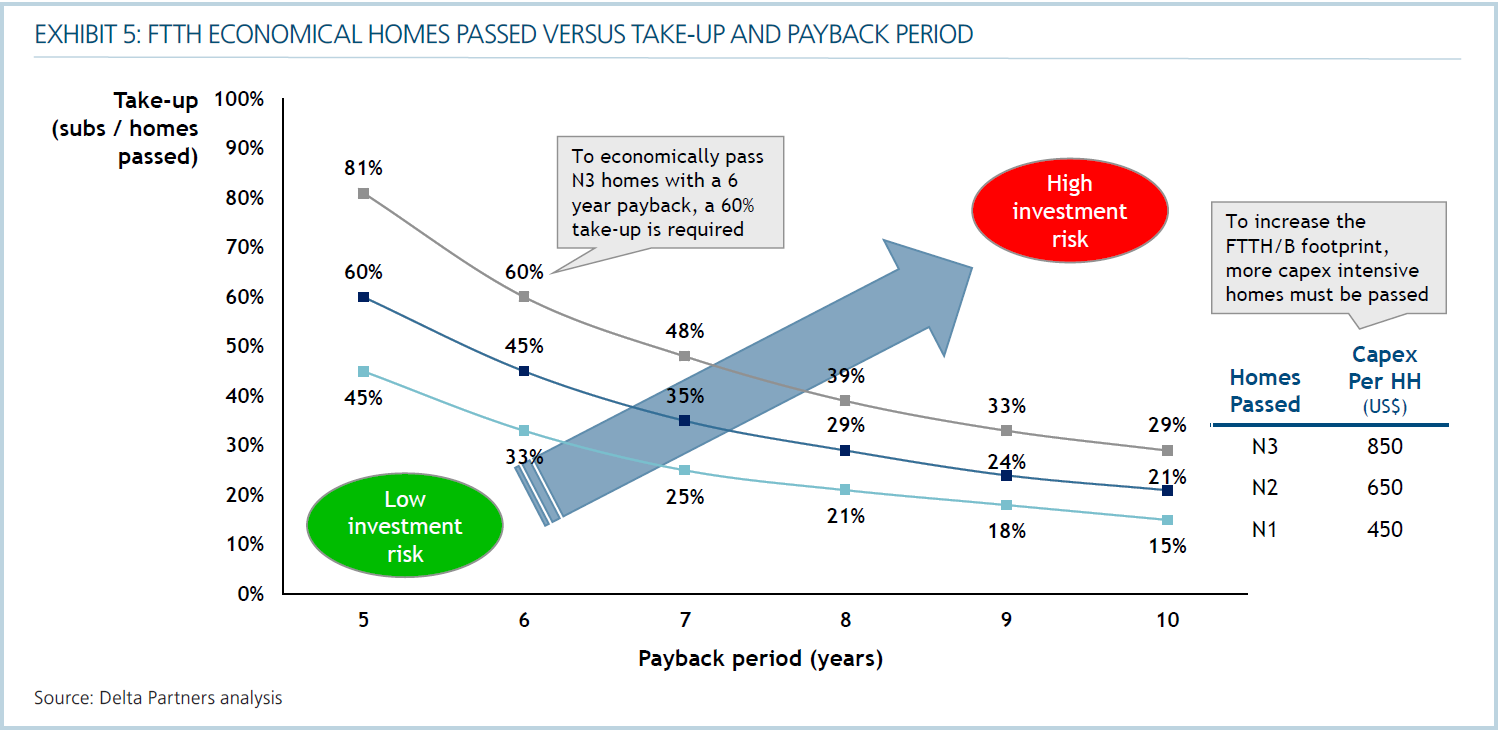
Assume that for logistical reasons, AT&T really can only build about three million locations each year, gets a 25-percent initial take rate, spends $700 to pass a location and then $500 to activate a customer location. Assume account revenue is $80 a month.


AT&T would spend about $2.1 billion to build three million new FTTH locations. At a 25-percent initial take rate, AT&T spends about $525 million to provide service to new accounts. So annual cost is about $2.65 billion, to earn about $720 million in new revenue (not all of which is incremental, as some of the new FTTH customers are upgrading from DSL).


The simple point is that building three million new FTTH locations per year, and selling $80 in services to a quarter of those locations, immediately,  does not recover the cost of capital.


So as controversial as the DirecTV buy might be, it at least had the advantage of throwing off cash flow. It is unclear whether the alternative of a big new FTTH build would have done even that well. At the time AT&T made the acquisition, DirecTV likely was throwing off something like


Enterprise WAN Spending Tougher to Pin Down

Just how much “enterprises” spend on wide area connectivity services no longer is a simple issue with a simple answer. Nor are the ways they choose to spend their money. 


For starters, enterprise demand has shifted dramatically. Decades ago, WAN connectivity was largely a matter of businesses buying private line services from service providers, with some private enterprise WAN services built using a mix of dark fiber and lit services. 


These days, WAN services are a wider mix of private networks owned directly by enterprises (for which no recurring fees are paid) and public services purchased from internet backbone providers, dominated by Ethernet-connected IP. SD-WAN is growing, as a percentage of WAN traffic. 


source: Cisco 


Private networks now carry a huge share of global WAN traffic, for example. And a relative handful of global content providers generate a majority of global traffic, carrying most of that on their own private networks


Some enterprises therefore build, own and operate their own global WANs, and do not buy WAN connectivity across their major routes. Others, including larger video streaming services, use edge caching as a substitute for WAN bandwidth. 


For such reasons, the global capacity services market is perhaps less robust than you might think. In 2020, perhaps $16 billion was earned selling transport services in North America and Western Europe. Triple to estimate global transport revenues for telcos and IP backbone providers and you reach $48 billion. 


MPLS, for example, increasingly is replaced by software-defined WANs. 


source: Ovum (Omdia) 


Though $48 billion is a significant amount, global spending on telecom services tends to run about $1.25 trillion to $1.4 trillion, for end user spending of all sorts, including consumer and enterprise, mobile and fixed, according to IDC.


So WAN connectivity services sold by service providers is perhaps 3,5 percent to four percent of total global service provider revenue. 

source: IDC 


One also has to break enterprise connectivity spending into fixed and mobile recurring services (as opposed to device spending, for example), as well as local access versus wide area network spending. MPLS and SD-WAN, for example, might represent less than a quarter of total networking spend. 


As we once counted local T-1 connections separately from WAN T-1 service, so enterprise broadband spending has to be separated into direct internet access (or other local access services) and then separate WAN spending. 


Much of the revenue in the software-defined wide area network market is garnered by infrastructure providers, in the same way that most of the revenue in the Wi-Fi market likewise is earned by suppliers of networking gear, not recurring connectivity services. 


That noted, many observers have expected a shift towards connectivity services over time. And though most estimates suggest a somewhat smallish market overall, there remains significant room for disagreement about evolution of the market, often perhaps exacerbated about whether one looks only at do-it-yourself infrastructure approaches or only at connectivity services, or both. A few estimates seem to be outliers, more connectivity revenue is possible.  


One way of estimating impact is to assume that SD-WAN replaces other services currently purchased by enterprises, especially MPLS, but also including direct internet access. 


source: Aryaka 


source: Field Engineer 


The reason SD-WAN is a growth area is the increased amount of enterprise cloud computing and multi-cloud computing. That increases the appeal of simple SD-WAN connectivity that does not require nailed up point-to-point connections.


Friday, October 2, 2020

Has Information Worker Productivity Suffered from Work from Home?

Nobody really knows how to measure knowledge or information worker productivity. One method, used by Aternity, is tracking business application use by workers at home. Using that measure alone, productivity in the early days of the pandemic declined in some countries and increased in some countries.


Perhaps more significantly, a “productivity hit” has continued through July 2020. 


“The main takeaway from Aternity’s latest data is that a ‘productivity tax’ is affecting enterprises deploying long-term remote work strategies,” Aternity says. “In countries where the remote work share remains at peak levels, including the United States and parts of Europe, employee productivity continues to fall.”


source: Aternity 


“In comparison, overall productivity is rising in European countries where the share of in-office work is increasing, showing that returns to the office are benefiting companies from an overall productivity standpoint,” Aternity says. 


While North America continues to have the highest share of remote work (85 percent), productivity decreased by 14 percent between March 26 and July 9, 2020 Aternity notes. 


In Europe, in-office work began to increase in early-mid May. Overall productivity increased by two percent between March 26 and July 9, with a sharper rise corresponding to the return to the office, Aternity says. 


Using only the “time spent on work applications” measure, productivity between January and March 2020 decreased in Europe and the United States, but increased in Canada. 


Keep in mind this is an input measure, not an output measure. All Aternity claims is that time spent using work apps either increased or decreased. The decrease in usage is defined as “lower productivity,” while an increase is defined as “higher productivity.” 


Wednesday, September 30, 2020

More Hybrid Work Patterns, but Good Reasons for Face-to-Face

The conventional wisdom about knowledge work is that it will be more hybrid in the future.  About 80 percent of 3,200 respondents to a Blind survey say they believe work will, in the future, involve some combination of “in the office” and “remote” work. 


That now is conventional wisdom. But note something else: about 45 percent of respondents said that not being able to get together in person with their team negatively affects their work, including 64 percent at Facebook, 63 percent of Google respondents and 56 percent of Uber respondents. 


For that reason, many of us expect that although more WFH will happen, more frequently, workers will continue to value face-to-face time. 


Tuesday, September 29, 2020

How Much Mobile Operator Success in 5G Private Networking?

How much revenue upside and value might mobile operators be able to create from 5G private networks? Some, but not as much as some might help, if history serves as a guide. The distinction between public wide area networks and private local area networks always has created leadership by different firms, and types of firms.


Simply put, local area networking has not been a core competency for public network service providers, nor does private networking tend to offer opportunities to achieve scale. Third parties are the low cost providers in the local networking business, making success a difficult proposition for higher-cost public connectivity providers unable to take advantage of economies of scale in private networks.


Private 5G networks, 5G fixed wireless, internet of things networks and large-venue 5G tend to share a characteristic in varying degrees: they shift the focus of connectivity from outdoors to indoors, wide area to local area, public network to private network, recurring connectivity revenue to equipment purchases.


So infrastructure sales will tend to shift a bit to private networks, a trend we now have seen embraced by a growing number of public network suppliers--including Samsung, Nokia and Ericsson--as well as emerging radio infrastructure suppliers. That means suppliers of public network infrastructure increasingly expect to be selling directly to enterprise end users, and not only to service providers.

source: Real Wireless 


What remains unclear is how the support infrastructure will develop. Some mobile operators likely will set up dedicated indoor networking units to design, build and support private 5G networks for enterprises. If history is any guide, most mobile operators will not have a sustainable business case serving anything but the largest enterprise venues or customers. 


Telcos have not managed to develop sustainable revenue models for indoor, private networking. Instead, interconnect firms (voice), system integrators, value-added distributors and other LAN specialists (data networking) have emerged to design, build and support premises networks. 


So third party specialists also will emerge, in all likelihood, particularly among the ranks of firms that historically support premises networking. 


Monday, September 28, 2020

Why U.S. Mobile Operators and Some Telcos are so Big on 5G Fixed Wireless

“Fiber is the network of the future, and always will be,” I once heard an engineering executive quip back in the 1980s. Though not literally true, the statement was a reasonable summation of the business context within which fiber to premises networks are deployed. Put simply, the business case is strongest when only one network can be built, while other platforms, even when built, have some performance or cost issues.


Consider this older analysis of fiber to home payback. Analysts at Delta Partners Group noted that in countries where governments have intervened with financial support in the FTTH market, including Japan, Lithuania, Malaysia, Portugal, Singapore, South Korea and the UAE, homes passed range from 47 percent in Sweden to 95 percent to 96 percent in South Korea and Lithuania. 


More important are take rates. There is relatively quick payback when consumer buy rates are in the 45 percent to 81 percent range, for example. In the U.S. market, where Verizon has deployed FTTH, it has only relatively recently gotten to a bit over 40-percent adoption, after 13 years of marketing, which is literally “off the charts” in this case. 


Delta Partners Group 


The problem for U.S. telcos is that rival cable operators have 70 percent of the installed base and have led in market share (net new additions every year) for two decades. Mobile operator interest in 5G fixed wireless is precisely that it offers a platform with different economics.

Sunday, September 27, 2020

Do Employees Understand AI Impact on Productivity Than Their Bosses Do?

Is it possible that employees of large firms have a better understanding of the impact of artificial intelligence on competitive advantage than their bosses do? Perhaps. 


It certainly seems to be the case that employees and C-level executives have different expectations about widespread AI adoption. 


Citrix sponsored a research effort conducted by Man Bites Dog and research company Coleman Parkes, polling 500 C-suite leaders and key decision makers within both large, established corporations and mid-market businesses with at least 250 employees. The study also involved surveying 1,000 employees. 


Fully 91 percent of professionals believe that by 2035, their organization will spend more on technology and AI than on human workers. Also, 90 percent of business leaders believe that in 2035, AI technology investment will be the biggest driver of growth for their organization.


By 2035, 83 percent of professionals believe that technology will have taken over low-value and repetitive tasks, enabling humans to focus on more meaningful work.


Some 89 percent of business leaders believe AI-powered digital workspaces will increase worker performance and productivity in their organization by 2035. Just 55 percent of employees share this view.


Fully 73 percent of business leaders believe that technology and AI will make workers at least twice as productive by 2035, while only 39 percent of employees share that belief.  


Only about 16 percent of business leaders say they are unclear about how their firms gain competitive advantages from AI, even when every major competitor uses AI. But 65 percent of employees say they are unclear on how their organization will gain a competitive advantage from using AI when it is being used by every business.


At least in part, employees seem to have a realistic understanding that AI will enable replacing humans with machines. Business leaders, though not immune from that process, tend to believe they will not be affected to the same extent. 


Perhaps shockingly, 57 percent of professionals believe that by 2035 there will be no traditional leadership team at all, as AI will make most business decisions.


Governments Likely Won't be Very Good at AI Regulation

Artificial intelligence regulations are at an early stage, and some typical areas of enforcement, such as copyright or antitrust, will take...