Saturday, November 14, 2020

Content Versus Distribution: Netflix Versus Disney: Where's the Value?

It has long been possible to get a reasonable debate on the respective values of content and distribution in the media business. Simply put, the issue is which part of the value chain is better positioned. Consider one illustration. The market value of Netflix is something on the order of $213 billion. Content creator Disney has a market cap of about $250 billion. 


Market cap is not everything, and both firms produce and distribute content. But it might be surprising that Netflix is so close to Disney, given its simpler business model, which includes original content production, but relies on distribution (subscriptions) for its revenue. 


Disney is far more complex, spanning movie and animation studios, broadcasting networks, content networks, theme parks, hotels, merchandise and video streaming operations.  


Think of Netflix as a content distributor, much as cable TV, satellite and telco video service providers; movie theaters; TV or radio broadcasters and increasingly, many online services and apps now act. True, Netflix invests heavily in original content, as do some other leading streaming video services. But its direct revenue comes solely from subscriptions. 


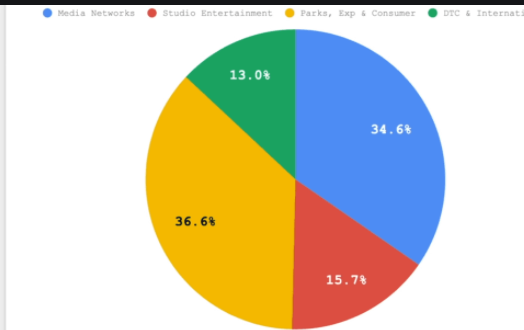
Notice something about Disney, though. Direct-to-consumer, which includes the Disney streaming service, with 73 million paid subscribers, generates significant revenue, but negligible operating income. Granted, that is partially because the Covid-19 restrictions closed the theme parks, while Disney’s streaming service is in start-up mode, so operating income might not be expected for a bit. 

source: Investopedia 


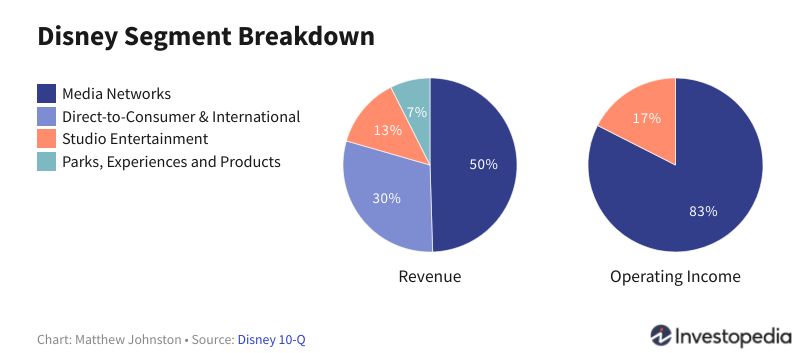
In a non-Covid environment, the theme parks (which includes hotels and merchandise) contribution to operating income would be vastly higher, between 20 percent and 33 percent of revenue. 

source: Nasdaq 


Operating income from theme parks, hotels and merchandise might range as high as 37 percent. 


source: Valuewalk


The point is that direct-to-consumer, lead by the streaming networks, should ultimately produce significant cash flow and operating income for Disney. The issue for some is how that cash flow and income might affect Disney value, and whether some different legal status for direct-to-consumer might affect the value of that unit. 


To be sure, some are unsure Disney streaming businesses can approach the size of Netflix, which already has perhaps 201 million million subscriptions. All Disney streaming properties collectively might reach about 100 million subscriptions. 


So the question is whether, someday, the value of Disney streaming is such that those assets would fetch a higher valuation if independent, as is Netflix.


Not Even FTTH Might Propel Non-Cable ISP Gigabit Share

One has to remain impressed with the commercial success of the hybrid fiber coax platform used by cable TV companies. Where most of the rest of the telecommunications world has remained fixated on fiber to the home as the platform of the future, cable operators tweaked an inconsistently-available coaxial cable network into the leading supplier of home broadband connections in the United States and a few other countries, with economics arguably better than FTTH for brownfield operations and a more-graceful approach to network upgrades.


In 2016 the cable industry passed about four percent of U.S. homes with networks offering 1 Gbps internet access. By 2018 80 percent of U.S. homes were able to buy gigabit per second service. 

source: CableLabs 


By way of comparison, all FTTH passings number something more than 50 million. There are about 141 million U.S. homes in total. So FTTH passes roughly 35 percent of U.S. homes. Not all those connections are capable of supplying gigabit connections at the moment, though. 


Assume there are 21 million active FTTH connections in the United States. Assume there are a total 103 million total broadband accounts. According to Openvault, in the third quarter of 2020 about five percent of U.S. customers bought gigabit service. 


That implies a total of no more than 5.15 million U.S. gigabit accounts in service. Assume all internet service providers other than cable operators have 30 percent of those accounts, implying about 1.5 million 1 Gbps ISP accounts sold by all firms other than cable operators. 


That further pimples that gigabit FTTH accounts in service represent about seven percent of active FTTH connections. Cable gigabit connections are likely to be closer to five percent of total broadband accounts. 


source: Fiber Broadband Association, RVA 


The point is that we sometimes too casually equate physical media with speed, or physical media with specific speeds, such as gigabit per second connections. Neither FTTH nor HFC directly equate with gigabit service or availability. 


However, cable TV operators do claim about 70 percent of the broadband installed base, possibly representing 3.6 million active gigabit accounts. As early as 2009, at least 75 percent of the fastest U.S. broadband connections were supplied by cable TV operators.  


At the same time, cable HFC platforms arguably have proven more effective than FTTH at generating incremental new revenues for platform owners, while suffering less from demand changes as voice and linear video began to shrink, the former since 2000, the latter since 2012 or so. Telco voice lines have fallen as much as 70 percent since 2000. Cable linear video accounts are down less than 15 percent since about 2012.  


Friday, November 13, 2020

FTTH is the Platform of the Future, But Might "Always Be"

People often forget that, in the communications business, there is no platform that always is best for every use case. What matters are the particular advantages. In other words, it has proven largely pointless to argue whether mobile or Wi-Fi access is “better.” Both have their contributions to make. 


In the fixed networks business, the belief has been--for many decades--that fiber to the premises is the future of the next-generation fixed network. 


With the caveat that there always is a private interest corresponding to every public policy, one cable TV industry vice president decades ago quipped that “fiber is the technology of the future...and always will be.”


Keep in mind, that was said about 40 years ago. And while North American access platforms have a different pattern than in most parts of the world, 40 years later, hybrid fiber coax platforms have about 70 percent share of the U.S. installed base of broadband connections. 


That creates a huge stranded asset problem for brownfield fiber-to-home deployments. Assuming a new FTTH network is deployed at scale, it might find that up to 70 percent of the assets are not generating broadband revenue. 


To be sure, there is still some amount of voice, but the old copper access network works well enough for that application. Investing capital on FTTH does not necessarily improve user experience, value or features for voice customers. 


For decades, though, there was one clear assumed advantage to deploying FTTH: the ability to sell linear entertainment video. So the basic thinking was that FTTH would allow telcos to hold broadband share while losing voice share and gaining video account share. 


It sort of worked that way until about 2012 for video services.

source: Business Insider 


But the “voice” part of the model never worked well at all, as usage, lines sold and value began to drop in the U.S. market as early as 2000, the peak year for telco access lines and long distance revenue


But business cases matter, and in the U.S. market the business case for FTTH, always difficult, has become quite challenged with the dominance of cable operators, and their seeming ability to keep pushing commercial bandwidths ahead faster than FTTH platforms. Already, at least 80 percent of U.S. homes have the ability to buy 1 Gbps internet access service, provided by cable operators. Not even most telco FTTH networks can do that, yet. 


Nor does it seem likely the cable cost advantage can be overcome any time soon, as technologists already are working on ways to boost HFC bandwidths to 10 Gbps or beyond, symmetrically. Sure, FTTH can do that as well, but not at the cost per home that HFC can provide. 


And that leads to telco interest in fixed wireless access, using 4G and 5G. The issue is not whether “fixed wireless can match FTTH” in potential speeds. The issue is whether fixed wireless can create a positive business case in areas where a new FTTH build is not financially feasible


Globally, matters can be quite different, as it often seems as though only one nationwide broadband fixed network can be supported. Still, in many other countries a mix of platforms is called for, based on home density. And then there is the matter of how people use the internet. 


By 2020, mobile accounted for more than half of all of Internet access revenue in more than 75 percent of countries, researchers at PwC said early in the year. Some analysts noted mobile Internet access revenues already had surpassed fixed network broadband revenue as early as 2013 or 2014.


That trend is expected to continue. By 2024, consultants at PwC say, mobile revenue will account for 68 percent of global Internet access market revenues. In other words, more than two thirds of all internet access revenue globally will be generated by mobile internet access. 


source: PwC 


FTTH is, in many countries, perhaps always the next-generation platform. In some countries, though, a mix of platforms is likely for decades. In a few countries, FTTH seems to be infeasible for consumer accounts, if deployed by telcos on a ubiquitous basis. Hence the interest in mobile access, or mobile network fixed access.


Thursday, November 12, 2020

U.S. Gigabit Take Rates Pass 5% for First Time

The percentage of U.S. fixed network broadband subscribers buying gigabit-speed connections surpassed five percent for the first time in the third quarter of 2020, reaching 5.6 percent, according to Openvault. That represents an increase of 124 percent from the third quarter of 2019, when take rates for gigabit services were 2.5 percent.


Gigabit service take rates reached 4.9 percent in the second quarter of 2020, says Openvault. Compare that to availability of gigabit services, which reach at least 80 percent of U.S. homes, counting only cable TV service provider facilities.


source: Openvault 


On the other hand, buyers of service at 10 Mbps and below also increased by 41 percent,  from 4.1 percent to 5.8 percent, quarter over quarter, Openvault says. “Growth at the lower end tier may be pointing to subscribers looking to save money with lower end, lower cost broadband tiers,” Openvault says.


Openvault says the “average” U.S. household (no idea whether this is median or mean) uses 384 GB per month, with average speeds downstream of 170 Mbps, upstream of 13 Mbps. 

source: Openvault

Half of all customers buy services providing downstream speeds between 100 Mbps and 400 Mbps. Nearly 30 percent of U.S. customers buy internet access at speeds ranging from 20 Mbps to 75 Mbps.

So it remains fair to say that there is a big difference between speeds consumers can buy, and speeds they actually do buy. Supply is one matter; demand another.

Impact of Covid on Telecom, IT Spending Not Yet Completely Clear

When all the data is available, it is likely we will find that the Covid-19 related work-from-home and other measures reduced global service provider revenues  a couple of percentage points, though some firms might have seen far-worse hits, and some see higher revenues


Overall, full-year global results might show less than one percentage slippage of service provider revenue, IDC predicts. 


source: IDC 


And in many cases, it will be hard to separate specific Covid-19 impact from the underlying trend of declining growth. Something similar might happen for information technology spending, even for cloud services which have been on a steady growth path.


Though it might seem obvious that information technology executives increased cloud computing spend to support remote workers during the Covid-19 pandemic, it is not yet so clear how much spending actually might have changed. It is possible we might actually see spending fairly close to what had been predicted prior to the pandemic. 


An October 2020 survey of 230 information technology professionals by OpsRamp finds 60 percent of firms increased IT budgets while 22 percent reduced spending in the second and third quarters of 2020. Some 63 percent of respondents reported accelerated or maintained digital transformation initiatives because of Covid-19.


The survey included IT professionals in the United States and United Kingdom working for firms with  at least 500 employees and $5 million in annual IT budgets. 


Reported priorities for IT leaders included information security and compliance (59 percent), remote work and collaboration (55 percent), public and multi-cloud infrastructure (50 percent) and monitoring and management (42 percent). 


Among capabilities acquired were artificial intelligence for IT operations (57 percent); digital experience monitoring (50 percent) and network performance monitoring and diagnostics (50 percent). 


A Computer Economics survey in August and September 2020 finds a split pattern of information technology operations spending: 30 percent increasing spending while 29 percent were decreasing. About 41 percent of respondents say there has been no change in spending. 


Back in April and May 2020, 41 percent of respondents reported unchanged spending. But 30 percent already had made moves to reduce IT budgets in response to  To the extent there had Covid-19 work from home rules.


Fig. 1: Organizations Planning Operational Budget Changes

source: Computer Economics


The 30 percent of respondents who reported cutting spending seems not to have budged much. In the fall, the percentage of respondents reporting lower spending was still 29 percent, substantially the same as the 30 percent who reported cuts in April and May 2020. 


What changed was the percentage of respondent firms that boosted spending, probably for hardware, software or services related to supporting remote workers. “Of course, the big reason for increasing budgets is to respond to the increased need for employees to work from home,” said David Wagner, Computer Economics senior research director. 


Fig. 1: Organizations Planning Operational Budget Changes

source: Computer Economics 


It is hard to separate out the response to Covid-19 remote work on cloud computing, which has been growing robustly before the work-from-home mandates were imposed. And even some firms that one might assume boosted cloud spending to support at-home workers eventually reduced spending from surge levels. 


Some studies suggest cloud revenue growth from 2020 to 2021 will be about 12.5 percent, perhaps lower than many would have expected, even under normal circumstances. The only issue is whether the work-from-home rules affected cloud computing uptake rates. And that might ultimately be a different matter from earlier expectations that cloud computing among smaller businesses, for example, would increase because of the pandemic. 


To some degree, the changes might hinge on whether customers are active about turning off or reducing payment for unused cloud services. It also will matter how much aggregate demand changed when workers shifted from offices to homes. In principle, that might have shifted the location of consumption, but not the volume of use. 


Though early in the pandemic many expected increased reliance on cloud computing, beyond growth already expected, we will have to wait and see what actually transpired. Covid impact might ultimately turn out to have been less of a change inducer than we expected. 

Tuesday, November 10, 2020

Alphabet's Taara to Deploy Free Space Optics in Kenya

Alphabet’s Project Taara is now working with Econet and its subsidiaries, Liquid Telecom and Econet Group, to commercially deploy free space optics trunking systems in Sub-Saharan Africa. The initial use cases will involve signal trunking across rivers or transmission through any other areas where it would be expensive, difficult or dangerous to lay physical cables, or where microwave radio would be the logical alternative,


source: Alphabet 


Taara’s links will begin rolling out across Liquid Telecom’s networks in Kenya first.


A single Taara link can cover distances up to 20 km and can transmit bandwidth of up to 20 Gbps or more, Taara says. The technology is a point-to-point trunking approach originally investigated to support Alphabet’s Project Loon internet access system using balloons.


In that use case, the problem to be solved was creation ofdata links between balloons that were flying over 100 km apart.


But free space optics has been proposed as a point-to-point trunking solution for decades in niche applications such as sending video security camera signals from remote locations to monitoring stations. 


The deployments illustrate how some technologies take decades to reach even relatively limited commercial use in the connectivity business.

When a Bug is a Feature

Somes a bug can be a feature. Consider atmospheric attenuation of radio frequency signals at 60 GHz, At that frequency, oxygen in the atmosphere attenuates about 98 percent of the emitted energy. That limits coverage. 


So it might be paradoxical that Terragraph is working to commercialize use of 60-GHz frequencies for internet access. At the same time, many internet access providers say they are going to use fixed wireless for internet access. 

source: RF Globalnet


One advantage of 60-GHz spectrum, in the U.S. market and in most countries is that the spectrum is available for unlicensed use. That has huge business case  implications for service providers compared to the alternative of building fiber-to-location networks. 


In the U.S. market, where consumer internet access is dominated by cable TV companies, fixed wireless might be the main way telcos can compete with cable offers. When the cable operator has about 70 percent of the installed base, the fiber to home cost per passing or cost per customer is a tough business case. 


In addition to no requirement to pay for a license to use the spectrum, the bandwidth is huge, about 14 GHz of capacity in the 57 GHz to 71 GHZ band available for U.S. unlicensed use. 


Another advantage is security. Because signal attenuation is so high, stray signals are confined. In an indoor Wi-Fi deployment, the signals will not often “leak” out of the building. In an outdoor access deployment, the signals can be highly linear, reducing the chances of accidental or purposeful unauthorized signal reception. 


There are interference protection advantages as well, In an indoors Wi-Fi deployment (local area network), adjacent 60-GHz transmitters are less likely to interfere with each other, which causes a reduction in experienced speeds and capacity. 


The same goes for line-of-sight, or near line-of-sight 60-GHz access transmitters: signals from one radio are less likely to interfere with signals from other transmitters.


Frequency reuse opportunities also are quite high, again a function of the “bug” of extremely-high signal attenuation. In the same way that small cells boost the intensity of usage for any specific block of spectrum, so 60-GHz signal attenuation allows a high degree “cellular” frequency reuse. 

source: RF Globalnet


Though high signal attenuation would seem to be a major bug, it might also be a key feature for 60-GHz frequency internet access. 


Will AI Supplant IoT?

It might be inaccurate or too early to determine whether the touted “fourth industrial revolution” is coming, and, if so, what the hallmark ...