Friday, December 10, 2021

Anti-Trust Rarely Succeeds Permanently

Most mature markets feature a rule of three or a rule of four. “A stable competitive market never has more than three significant competitors,” BCG founder Bruce Henderson said in 1976. That often means the top-three providers have market share in the 70 percent to 90 percent range. 


The rule of four refers to the expected market share in a stable market, where leader market share is twice that of provider number two, and where the number-two supplier has double the share of the number-three provider. 


That creates a stable market share structure of 4:2:1. It arguably is stable because there is little incentive for either number one or number two to disrupt the market by attacking to gain share.


All of that explains the periodic waves of anti-trust action we see in many markets. Though there seems to be non-existent interest in anti-trust in the cloud computing “as a service” markets, some speculate it could eventually happen. 


The issue is that such regulatory action never lasts. Competitive markets will revert to the rule of three or rule of four structure again. Look at U.S. telecommunications, where a former monopoly by AT&T was ended in 1982, creating eight new contestants instead of one AT&T. 


What do we see some 40 years later? Essentially the rule of three. The rule of four is not yet in place, though. 


There also generally is a direct relationship between market share and profitability.  Some note there is a similar return on sales and market share relationship.


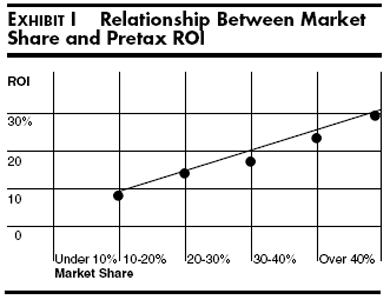
source: Marketing Science Institute


The point is that it is reasonable to expect that profits are directly related to market share, with a pattern where the leading three firms have something like a 40-20-10 share pattern, or perhaps 35-17-8 pattern.

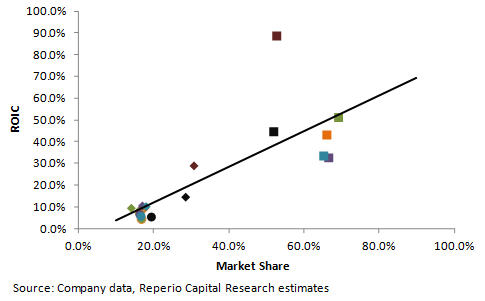
Source: Reperio Capital


That pattern is--contrary to often-made claims--not a result of lack of competition, but instead evidence that competition exists. Competition means buyers gravitate to the perceived better products. That, in turn, leads to market share gains. 


At some point, it is in the self interest of contestants not to wage ruinous price wars. Such wars depress earnings and profit margins for all contestants, but rarely change the relative standings. The more-profitable leader can absorb the losses more easily than the less-profitable attackers in second or third place. 


Anti-trust action rarely, if ever, results in permanent change.


Will Mobile Operators Get 10% of MEC Revenue?

Security services, IoT and edge computing combined will amount to about $50 billion in annual service provider revenues by 2024, according to the IN Forum.  If cumulative growth rate for those services is 17.9 percent, then 2026 revenue might be about $70 billion globally. 

source: IN Forum 


To be sure, much-larger “total market” forecasts are possible if one adds to service revenue the contributions of hardware, software and other infrastructure, application licenses, system integration revenues and private enterprise investments and operations spending on edge computing, IoT, security. 


Looking only at edge computing, and all revenue segments, as much as $250 billion in annual revenue might be possible in 2025. It is possible service provider revenues from edge computing in that year might amount only to $20 billion.

Where Might Telcos Have Advantages in Multi-Access Edge Computing?

If we agree that edge computing brings cloud services and capabilities including computing, storage and networking physically closer to the end-user, then we also might agree that edge computing value will be generated as computing and cloud services can be executed locally. 


A corollary is likely that the suppliers of brand-name cloud apps and computing as a service will have a big role in edge computing, as buyers will be looking for functionality provided by the name-brand apps. 

source: STL Partners 


Mobile and fixed network connectivity suppliers have viewed edge computing as a way to increase the value of their assets and services. Mobile operators see 5G private and public network access as an opportunity to support ultra-low latency use cases, for example. 


Other participants in the connectivity value chain (tower operators, data centers, system integrators and infrastructure providers) might also see opportunities. 


Local real estate also is an opportunity, in the form of space, cooling, security and power for edge servers. Such real estate can be provided at a cell tower, street cabinet, network aggregation point, a central office or internet exchange point, for example. 


source: STL Partners


More complicated are moves to supply the actual computing as a service function. In fact, recent moves by leading U.S. mobile operators to use hyperscalers as the suppliers of the cloud computing to support the 5G network cores illustrates the advantages of not creating a custom computing function, even to support the internal operations of the 5G virtualized network. 

source: STL Partners 


Most telcos are looking at the brand-name hyperscalers to supply the computing platform, for example. That is not to say all telcos will do so. 


It is possible, in some regions, that connectivity providers will have greater opportunities to create general purpose edge computing infrastructures that have brand-name computing as a service suppliers present as tenants, much as hyperscalers are tenants at third party data centers. 


On the other hand, hyperscalers also will aim to supply on-the-premises edge computing facilities for enterprises, thus avoiding the need for much “in the metro area” real estate. 


It is too early to predict precisely which business models will flourish, as far as telco edge computing involvement.

Wednesday, December 8, 2021

Study of Kubernetes App Success Shows How Hard New Apps are to Create

A study shows the difficulty of successfully shifting from development to commercial deployment of Kubernetes. That is a better ratio than typically is found in general business transformation or information technology change projects, which tend to have success in the 30-percent range. 


70 percent failure rates are common for IT efforts. That same ratio also tends to hold for organizational change efforts. The rule of thumb is that 70 percent of organizational change programs fail, in part or completely.  


The survey  by D2iQ found 42 percent of Kubernetes applications that work in a pre-production phase were actually deployed commercially. 


Historically, most big information technology projects fail in some major way, failing to produce expected cost savings or revenue enhancements or even expected process improvements. 


Some would argue the digital transformation failure rate is the same. “74 percent of cloud-related transformations fail to capture expected savings or business value, ” say McKinsey consultants  Matthias Kässer, Wolf Richter, Gundbert Scherf, and Christoph Schrey. 


Of the $1.3 trillion that was spent on digital transformation--using digital technologies to create new or modify existing business processes--in 2018, it is estimated that $900 billion went to waste, say Ed Lam, Li & Fung CFO, Kirk Girard is former Director of Planning and Development in Santa Clara County and Vernon Irvin Lumen Technologies president of Government, Education, and Mid & Small Business. 


BCG research, for example, suggests that 70 percent of digital transformations fall short of their objectives. 


From 2003 to 2012, only 6.4 percent of federal IT projects with $10 million or more in labor costs were successful, according to a study by Standish, noted by Brookings.


So perhaps Kubernetes applications succeed at a higher rate than for other IT projects: about four out of 10, where bigger projects succeed about three times out of 10.


Monday, December 6, 2021

Big Change for AT&T FTTH Payback Model?

The economics of fiber to the home infrastructure have never been easy, in the United States or anywhere else. But the business case is quite different now than two decades ago. Consider the metrics AT&T CEO John Stankey mentioned at the UBS Global TMT Conference


Talking about the pace of FTTH deployment in the consumer market, Stankey said “we've turned the corner in the consumer space on EBITDA growth,” elaborating that “we're watching those returns improve every quarter.”


And Stankey expects even better payback models as AT&T scales its FTTH deployment and revamps its operating cost structure. 


“When we can get into that space with customers that are paying us $50-plus a month and we're splitting share in that market, that's a good place for us to be over the long haul,” said Stankey. 


There are two key elements there: broadband market share very close to 50 percent and average revenue per location in the $50 a month range. The former would be a historic shift in market share and installed base. The latter is important because it shows the lower payback threshold. 


A couple of decades ago, the payback would have assumed something more on the level of $130 to $150 worth of monthly revenue from a consumer customer location, driven by the triple-play bundle of voice, internet access and linear video. 


The actual penetration rate was complicated, as there were a mix of single product, dual-play and triple-play accounts, each with different ARPUs. For AT&T, the road ahead remains a bit complex, but will be anchored in broadband. 


The FTTH payback decision would seem to be based on at least $50 a month for internet access as the base case, with a mix of customers buying voice, streaming or linear video products that will be non-consolidated items provided by Discovery Warner-Media, with AT&T receiving about 71 percent of the free cash flow. That might represent about $8 billion in annual free cash flow for AT&T, as its share of the proceeds from Discovery Warner-Media. 


The big change is the strategy. Essentially, the FTTH payback is anchored by internet access of perhaps $50 per location, with adoption close to 50 percent, and aided by voice and video entertainment contributions at lower levels. 


That is a huge assumption change from two decades ago, when revenues in the $130 to $150 per month range were assumed to be necessary. To be sure, AT&T also has get close to half the consumer broadband services market, in terms of installed base. 


But AT&T executives seem quite encouraged by trends they have seen in the latest rounds of FTTH builds.


Southeast Asia Mobile Operator Consolidation Trend Might Happen Elsewhere As Well

Southeast Asia has been a region some believe will inevitably see telco consolidation, especially among mobile service providers. Indonesia, Malaysia and Thailand provide examples. 


But consolidation is a global trend. Where there now are 810 telecom service providers, there will be 105 by 2025, says Bell Labs. That represents a consolidation of about 87 percent in seven or eight years.


For its part, analysts at Capgemini call for an era of “massive consolidation” on a “spectacular” level.


There are many reasons for consolidation. Mobile and fixed services are inherently capital intensive, and there is evidence that capital intensity is increasing. To the extent there are scale advantages, consolidation improves scale, and therefore offers hope of lower costs. 


In substantial part, those changes are driven by different charging models. The voice business, which once drove industry revenues, was based on a charging system built on usage: “the more you use the more you pay.”That is helpful in the sense that when demand grows, so does revenue.  


The new business model built on data usage is different. There still is a usage component to the charging system. Customers can purchase usage rights that vary by quantity. But two other trends also matter: “unlimited usage for a fixed price” and “much-lower unit prices.” 


The former severs the link between usage and revenue while the latter means higher usage does not produce comparable incremental revenue. One can see this in the fact that average prices paid for internet access service have remained stable--or fallen--even as usage has doubled every two years. 


As this graph illustrates, mobile data supply has grown by an order of magnitude about every four to 10 years since 1985. 

source: Science Direct 


Customer data demand arguably has grown faster than that rate of spectrum increase. That networks have not saturated is because mobile operators have other tools to increase capacity, beyond adding new spectrum. They can use smaller cells, different radio technologies, better coding and modulation. 


source: Lynk 


Still, the business issue is that it is hard to increase revenue as fast as network supply has to be boosted. To make the business case work, the cost per bit has to keep dropping. That is partly a technology platform issue and partly a capital investment and operating cost issue. 


One reasons consolidation will continue to make sense is that it can help mobile operators reduce capex and opex, while boosting spectrum assets. 


Thursday, December 2, 2021

As Important as Edge Computing, IoT and Security Are, ARPU Increases and Account Growth Will Drive Service Provider Business Revenue

Most “new source of revenue” growth opportunities available to fixed and mobile service providers are incrementally important. Very few are expected to produce huge amounts of revenue in the near term.


On the other hand, most of the revenue volume will come from tweaks to the existing revenue model (consumer phone service). Perhaps surprisingly, 5G fixed wireless could be one of the biggest near-term contributors to new service revenue. 


Deloitte Global predicts that the number of FWA connections will grow from about 60 million in 2020 to roughly 88 million in 2022, with 5G FWA representing almost seven percent of the total. Most of the installed base consists of 4G connections and it will take some time for 5G to overtake 4G. 


By 2026 there could be 160 million FWA accounts in service. At an average monthly cost of $20, that generates perhaps $38.4 billion in service revenue. At $40 per month, FWA generates perhaps $76.8 billion in service revenue. 


The total fixed network broadband installed base is expected to be about 1.75 billion accounts in 2027. So FWA will represent about nine percent of total fixed network broadband accounts. 

source: Ericsson 


Compare that with projected revenues from other more-touted services such as internet of things, edge computing and security. Those three services will in 2024 amount to about 12.6 percent of total business service revenue of $400 billion globally. 


So security services, IoT and edge computing combined will amount to about $50 billion in annual revenues by 2024. If cumulative growth rate for those services is 17.9 percent, then 2026 revenue might be about $70 billion globally. 

source: IN Forum 


If global telecom service revenue is about $1.6 trillion in 2025, and consumer revenues are about 65 percent of total service provider revenues, then business revenues could hit $560 billion in about 2025 or 2026. 


If you assume consumer services in 2025 or so will be about 60 percent of total revenues, then business revenues could be as high as $640 million. 


How much of that could come from new sources such as edge computing, security and IoT is the issue. If those new sources are 12.6 percent of total business revenues, then existing business services will represent 87 percent of total revenue, or anywhere from $330 billion up to $556 billion.


In other words, improving revenue from existing services still drives most of the possible business revenue improvement. 


It is possible that fixed wireless access is a bigger business than edge computing, security and IoT in 2026. At the low end of the FWA estimates, fixed wireless might still be bigger than any of the other new services individually. 


The point is that we tend to overlook the new revenue impact of FWA, focusing on the more-touted areas of security, IoT or edge computing. But FWA is possibly going  to be a bigger revenue contributor. 


While fixed wireless will grow about 19 percent per year to 2026,  5G FWA connections will grow at an annual cumulative growth rate of nearly 88 percent, over the same period, Deloitte Global says. 


source: Deloitte Global 


source: IN Forum 


source: IN Forum 


source: IN Forum 


source: IN Forum


CIOs Believe AI Investments Won't Generate ROI for 2 to 3 Years

According to Lenovo's third annual study of global CIOs surveyed 750 leaders across 10 global markets, CIOs do not expect to see clear a...