Sunday, October 16, 2022

Is Meta the First of Today's Computing Leaders to Falter as We Head for the Next Generation?

It often is asserted that the leaders in one era of computing technology are not the leaders in the next. Whether one looks at the market share leaders, the lead devices, network architectures or applications, computing eras lead to distinct business opportunities. 

source: Dr. James Coakley, Oregon State University


So to the extent that Amazon Web Services, Google, Azure, Facebook or Apple have been seen as leaders of the present era of computing, we should at least hold open the thought that this will not always be the case, as hard as that might be to fathom. 


Facebook--now Meta--might be the best example of how leadership is lost. It can be argued that Facebook’s pivot to metaverse is evidence that the traditional growth drivers of advertising are not expected to fuel the company’s continued growth. 


Perhaps even more oddly, Facebook’s traditional reliance on app layer advertising might arguably be said to be at risk as a new era with more reliance on appliances, devices and hardware could be dawning. 


Consider the oddity of that argument. Apple, over much of the last two decades, has had to shift to services and apps to diversify its revenue away from a reliance on devices and hardware. 


Now it might be applications-driven Meta that has to figure out a way to get into the hardware business. Consider that both Google and Amazon have developed important hardware and device businesses to support their application, advertising and commerce business models. 


Perhaps Meta’s big strategy shift is the first sign that the next wave of computing will feature different leaders.


If Home Broadband is a Computing Product, Price Trends Make Sense

Total worldwide telecom revenues from mobile and fixed broadband services will grow 14 percent  between 2022 and 2027 to reach €1.2 trillion according to  Omdia. But monthly Average Revenue Per User will fall by 4.2 percent from €7.48 in 2022 to €7.16 in 2027, India researchers say. 


You might think new 5G services and faster home broadband would lead to a different result. But that is not the historical record. According to the U.S. Bureau of Labor Statistics, prices. for internet services and electronic information providers are 19.49 percent lower in 2022 versus 1997. 


Between 1997 and 2022, internet services experienced an average inflation rate of -0.86 percent  per year, even as access speeds continued to climb steadily. 


source: Omdia 


Competition explains some of the results. Indirectly, lower costs per bit explain some of the pricing trends, as access networks work more efficiently over time. While lower costs per bit do not directly explain lower recurring costs, they help internet service providers maintain profit margins even when delivering more capacity. 


Pricing trends for other digital products, such as computing devices, also seem to dictate pricing policies. Personal computers and other devices tend to improve performance over time while retail sales prices retain roughly flat. 


source: Free by 50 


But it also seems to be the case that retail prices for internet access are shaped by wide area network costs; lower costs of computing generally and by ISP pricing practices, which are not strictly usage-based. 


Though mobile operators do sell packages of usage that vary by “amount consumed,” the relationship between units consumed and price-per-unit drops with higher volume. 


Fixed network operators tend to price on advertised headline speed, not consumption. Historically, higher speeds have always led to higher data consumption, so higher speeds almost automatically come with lower unit prices. 


Ultimately, it seems Moore’s Law seems to be at work--not as a principle related to transistor density--but as a description of retail pricing. Since customer spending is never unlimited, we see doubling of capability every 18 months or so, while prices drop or remain the same. 


Internet access essentially is valued as a computing product. Retail prices, at least, suggest that form of valuation by customers. And that means higher capability at constant or lower prices will be expected. 


Competition matters, of course. But global prices for internet access seem to exist, as though the product were oil, where prices are inherently globally set. Local levels of competition matter, but overall, prices seem to act as though global norms prevaill.


Saturday, October 15, 2022

Home Broadband Prices Generally Drop Globally, With Some Exceptions

This chart showing typical monthly costs and typical speeds illustrates why the internet access business is so challenging. Note that typical monthly charges are the same, whether we compare slow copper connections or faster cable TV and telco connections using optical fiber. 


In other words, there is a tendency in the internet access business for capacity supplied to grow but for revenue to remain flat. 


source: Point Topic


Keep in mind that this study of published tariffs shows “average” prices across a range of products using the pricing power parity method, which normalizes prices across countries to account for currency effects. 


source: Point Topic


In the absence of specific detail on whether median or mean figures are used, I assume the stated prices and speeds use the mean. But the biggest impact on stated prices is the use of PPP to normalize local prices across countries. 


One often hears that the typical U.S. home broadband account generates $50 per month. Using PPP, that normalizes to $94 per month. Other countries whose monthly recurring charges often appear to be lower, are higher when using PPP. 


In most regions, prices are dropping. In South and East Asia prices are stable. Only in North America are prices rising. That appears to be a byproduct of customers migrating to higher-priced service packages that run at faster speeds, as well as speed increases by ISPs. 


In the first quarter of 2022, for example, about half of accounts operated at speeds between 200 Mbps and 400 Mbps. A year earlier, half of customers purchased plans operating between 100 Mbps and 200 Mbps, according to Openvault data. 

Friday, October 14, 2022

Faster Home Broadband Just Keeps Coming, As Edholm and Nielsen Laws Predict

Google Fiber will launch 5-Gbps and 8-Gbps internet access service in early 2023. Both products will offer symmetrical upload and download speeds, Google says. 


Google Fiber launched gigabit service in 2010, 2-Gbps service in 2020 and (and is testing 20-Gbps service. 


The 5-Gbps tier will cost $125 per month, while the 8-Gbps tier will cost $150 per month. 


Separately, it seems increasingly likely that Comcast will begin to introduce service at speeds possibly in the 4-Gbps to 6-Gbps range in 2023. And those services might well be symmetrical, able to extend to 10-Gbps symmetrical. 


Those speed increases are predictable and expected according to two theorems. 


Nielsen's Law suggests that the top-end speed will grow 50 percent per year. Edholm’s Law states that internet access bandwidth at the top end increases at about the same rate as Moore’s Law, which is about a doubling every 18 months or so. 


That means the top-end home broadband speed could be 85 Gbps to 100 Gbps by about 2030. 

source: NCTA  


Nielsen Norman Group estimates suggest a headline speed of 10 Gbps will be commercially available by about 2025, so the commercial offering of 2-Gbps and 5-Gbps is right on the path to 10 Gbps. 


AT&T, for example, just activated symmetrical 2-Gbps and symmetrical 5-Gbps service for 5.2  million locations across 70 U.S. markets, with plans to deploy across the whole footprint in 2022 and later years. 


There is widespread expectation that the headline speed for home broadband, in many markets, will be 10 Gbps by about 2025. 


By other rules of thumb, that also suggests the "typical" home broadband customer will be buying service at rates between 1 Gbps and 2 Gbps, with a significant percentage buying service at 4 Gbps. 


Nielsen’s Law has operated since the days of dial-up internet access. Even if the “typical” consumer buys speeds an order of magnitude less than the headline speed, that still suggests the typical consumer--at a time when the fastest-possible speed is 100 Gbps to 1,000 Gbps--still will be buying service operating at speeds not less than 1 Gbps to 10 Gbps.  


source: FuturistSpeaker 


So top end speeds in the terabits per second are virtually inevitable by about 2050. The emergence of offers between 2 Gbps and 5 Gbps now is simply evidence that the trend continues. 


At the moment, top speeds in the U.S. market are in the 2 Gbps and 5 Gbps ranges.Comcast has introduced 3-Gbps services for business. Ziply has introduced symmetrical 2-Gbps service. Google Fiber has added 2-Gbps as well. 


Frontier Communications is doing the same. Verizon offers 2-Gbps Fios service. AT&T sells both 5-Gbps and 2-Gbps service. Many of those offers feature symmetrical bandwidth


Perhaps the greatest value change, though, is not the headline downstream speed, but the symmetrical speeds, as in the U.S. market asymmetrical services sold by cable operators have nearly 70 percent market share. 


Though the cable hybrid-fiber coax networks can be configured to support more upstream bandwidth, fully-symmetrical service typically requires switching to fiber-to-the-home platforms. 


To scale new capital investments, cable operators in many cases will choose to extend downstream speeds and lift upstream speeds, approaching or reaching fully symmetrical service with DOCSIS 4.0 before considering other measures such as switching to FTTH. 


If the “typical” customer buys a service operating at up to an order of magnitude less than the highest headline speed, we might infer that the typical home account--offered by ISPs with various speed plans--will be buying service at speeds between 500 Mbps and 800 Mbps in 2025. 


Keep in mind that Google Fiber’s footprint is quite limited, so not many households will be able to buy Google Fiber service, now generally available at either 1-Gbps or 2-Gbps speeds. In such cases, the headline speed and the median speed tend to be virtually identical. 


The real local market test will tend to be the 2-Gbps to 5-Gbps services sold by Comcast, which has the biggest home footprint, or AT&T, with perhaps the third-biggest footprint. But those services are marketed mostly to business customers, at this point. 


Thursday, October 13, 2022

Fixed Wireless, So Far, is the First Significant New Use Case for 5G

Promoters of every digital next-generation mobile network have promised and hoped for the creation of new use cases and applications. And that arguably has happened, though often not as fast as expected or in the way expected. 


Still, new use cases always have developed with each successive next generation mobile platform. Early in the 5G era, most observers now recognize that 5G fixed wireless has become the first obvious new use case for 5G. 


Most observers believe the internet of things, private networks, edge computing and virtual private networks are likely additional use cases. Opinion is more divided about the use of 5G to support more-immersive applications (gaming, digital twins) and understandably quite divided about whether the full metaverse of persistent, three-dimensional experiences will require 5G, and if so, to what extent and by what date. 


The only clear pattern is higher data consumption. 


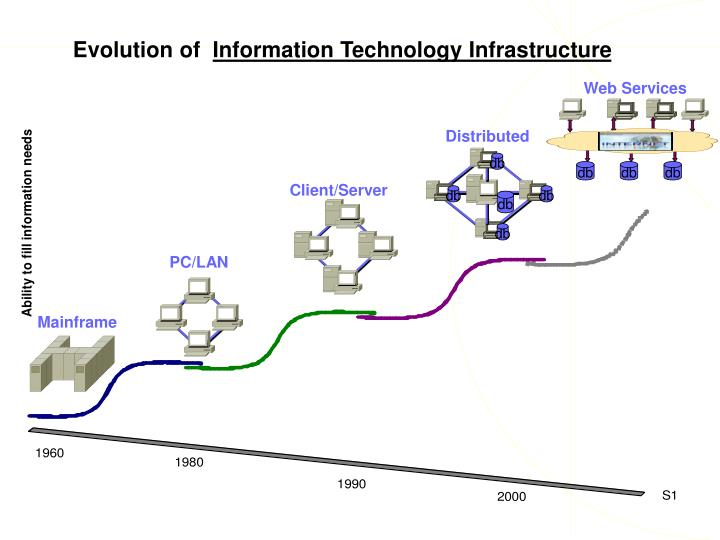
Higher data consumption also seems a hallmark of each next generation platform. With the caveat that some of the increase is driven by greater numbers of subscribers, the trend of higher usage has been in place since at least 2005. Still, nobody would contest the argument that users consume more data on faster networks.  


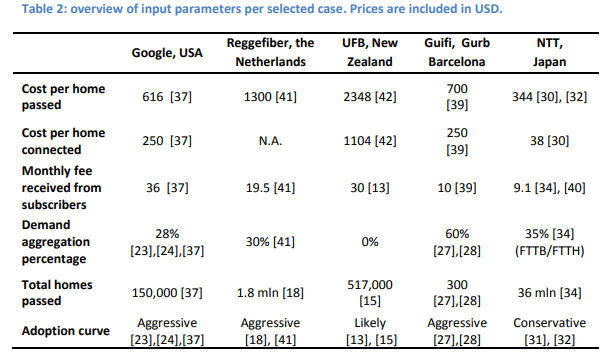
source: Researchgate 


The usage increases have many drivers. As networks get faster, more video content is pushed out, and video is the media type with the highest bandwidth requirements. As networks get faster, people can do more in the same amount of time. So in any X block of time, more data will tend to be consumed. Also, as more content, transactions and activities are available online, more people spend more time interacting online. All of that drives higher data consumption. 


source: Ericsson 


Perhaps significantly, Ericsson’s ConsumerLabsurveys found that 5G users consume more content than do 4G users. They stream more high-definition video, more music, play more multiplayer games, download more HD content and engage in more cloud gaming, for example. Though some might find the use of augmented reality apps at an early stage, Ericsson finds that 5G early adopters use more AR content and apps. 

source: Ericsson 


So 5G is “crossing the chasm,” Ericsson says. The chasm is the big jump in value proposition required for a technology product to appeal to mainstream customers. 


Ericsson’s ConsumerLab research suggests that the adoption process is most advanced in South Korea, among 37 global markets where Ericsson conducted surveys. 

source: Ericsson ConsumerLab 


Ericsson uses segment definitions that intend to capture technology attitudes and willingness to adopt new technology. 


Tech enthusiasts are high-income, well-educated, between 25 and 39 years old, power users of mobile broadband who are driven by new technology, premium devices and rich experiences. They want to be the first people to try 5G and also let the world know about it. However, they are less sensitive to any initial limitations of 5G.


The tech-intrigued are primarily younger students, heavy mobile broadband users, especially heavy on online gaming. Very interested in 5G services which offer diverse types of entertainment content.


Tech pragmatists are middle-age parents, moderate or mainstream users of mobile broadband. They often will need proof of any benefits to 5G before investing. They are interested in 5G services that support them in organizing their work and daily life.


Late tech adopters: Low-income, light users of mobile broadband who are mobile first. They have a rather basic use of online services but are interested in 5G services that enrich connecting with others.


The tech-averse are unemployed, retired, older age group and lower-income users who do not see value in 5G.


Those categories roughly map to similar adoption segments popularized by Professor Geoffrey Moore. 


For most consumer technology products, the chasm gets crossed at about 10 percent household adoption. Moore does not use a household definition, but focuses on individuals. The chasm is crossed at perhaps 15 percent of persons, according to technology theorist Geoffrey Moore

source: Medium


Both ways of counting--households for some products, persons for others--are roughly analogous, given household sizes of about 2 to 2.5. The “household versus person” correlations would not work so well in countries where household sizes are larger. 


Perhaps shockingly for an innovation that promises much-faster access speeds, most respondents who plan to adopt 5G indicated that coverage was more important than speed. That would be typical for mainstream users who are less tolerant of product shortcomings. 


Mainstream customers are less interested in “bleeding edge performance” and “just want it to work.” Also note that the next wave of 5G adopters is far less interested in innovative apps, unlike the “tech enthusiasts.” 
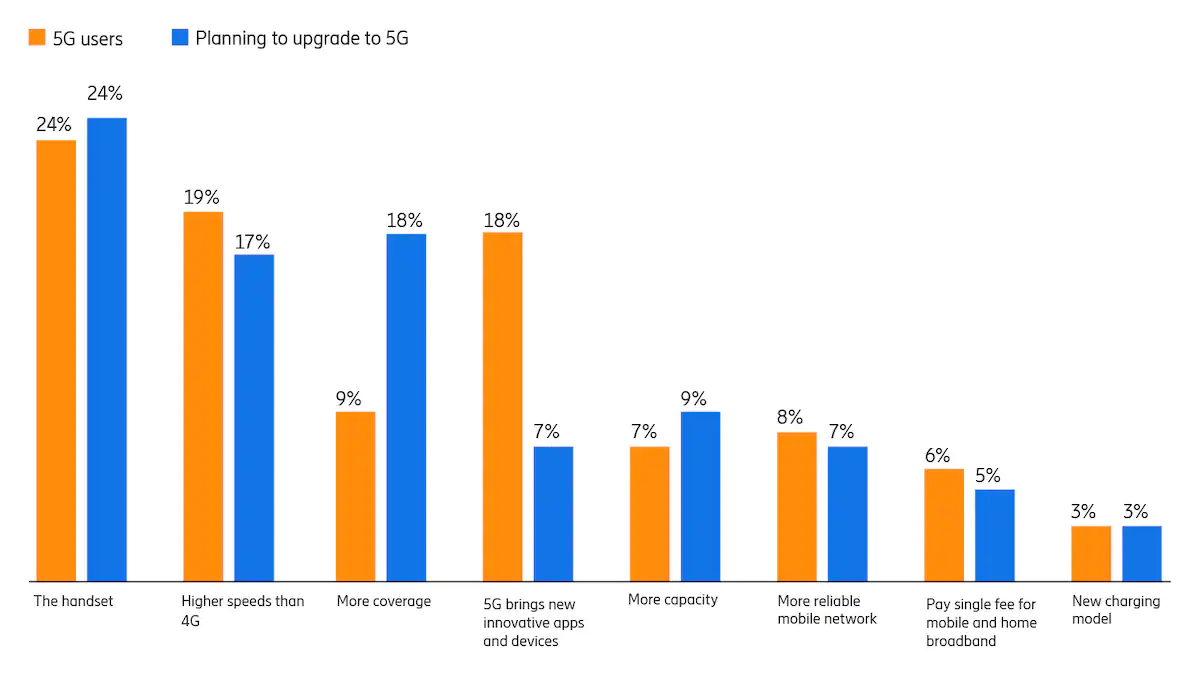
source: Ericsson

Wednesday, October 12, 2022

How Much Disaggregation of the Connectivity and Data Center Businesses is Possible?

How much could connectivity service provider models disaggregate? Quite a lot, some believe. 


Consider the analogies of the digital infrastructure value chain to the hospitality value 

Chain (hotels and lodging). That ecosystem and value chain aer built on passive assets such as buildings and land. That is a real estate play with investment time horizons possibly in the decades. 


Then there are hotel properties built to supply lodging, which can use a variety of business models, ranging from real estate rentals to physical facilities management and operations. Investment time frames in this segment also can stretch out for a couple of decades. 


Then there are “brands” that are service providers, essentially focused on marketing and sales functions with scale economies. 

source: European Commission 


To use the connectivity provider analogy, there are digital infrastructure passive assets such as tower locations or some aspects of the data center business. Active assets include data center services, ranging from rack space to virtual service functions, or active wholesale connectivity networks. 


Then there are the clear retail “service” providers supplying internet access, mobile service or  “computing as a service” or “infrastructure” or “apps” as a service under a specific brand name. 


As in the hotel business, branded services often operate with shorter investment payback time frames (five to six years) while full real estate plays often are better suited to patient long-term investors who value predictable income streams more than asset appreciation. 


Private equity tends to operate with shorter five to six year horizons, with a focus on restructuring business models and operations to generate asset value and then selling those assets. 


The thinking there is that the ultimate buyers are patient investors able to handle a 20-year investment return cycle. Private equity acts as a shorter-term value reconstruction play, with the exit being a sale of the assets. 


The issue is the long-term impact on  the connectivity and data center businesses. Will branded service providers more often operate in the marketing and sales functions, and less in the ownership of physical networks part of the business? 


Will many or most service providers eventually resemble mobile virtual network operators who do not own physical network assets? That would be a big change in both fixed and mobile segments of the connectivity business. 

Monday, October 10, 2022

Shocking FTTH Revenue Assumptions

The economics of connectivity provider fiber to the home have always been daunting, but they are, in some ways, more daunting in 2022 than they were a decade ago. The biggest new hurdle is that expected revenue per account metrics have been cut in half or two thirds. That would be daunting for any supplier in any industry. 


These days, the expected revenue contribution from a home broadband account hovers around $50 per month to $70 per month. Some providers might add linear video, voice or text messaging components to a lesser degree. 


But that is a huge change from revenue expectations in the 1990 to 2015 period, when $150 per customer was the possible revenue target.  


You might well question the payback model for new fiber-to-home networks which assume recurring revenue between $50 and $70 per account, per month, with little voice revenue and close to zero video revenue; take rates in the 40-percent range; and network capital investment between $800 and $1000 per passing and connection costs of perhaps $300 per customer. 


But that is the growing reality. Among the reasons: higher government subsidies; indirect revenue contributions and a different investor base. 


All that has shifted fiber-to-home business models in ways that might once have been thought impossible. 


In the face of difficult average revenue per account metrics, co-investment and ancillary revenue contributions have become key. Additional subsidies for home broadband also will reduce FTTH deployment costs. All that matters as revenue expectations are far different from assumptions of two decades ago. 


“Our fiber ARPU was $61.65, up 5.3 percent year over year, with gross addition intake ARPU in the $65 to $70 range,” said John Stankey, AT&T CEO, of second quarter 2022 results. “We expect overall fiber ARPU to continue to improve as more customers roll off promotional pricing and on to simplified pricing constructs.”


Mobility postpaid phone ARPU at AT&T was $54.81. According to some studies, fiber-to-home recurring revenue is lower than that. But AT&T appears to be taking market share from key competitors where it has deployed new FTTH facilities. 


Different investors also are becoming important for access infrastructure. Retail connectivity providers are judged by their ability to generate cash flows, but hampered by the huge capital investments they must make to do so. Institutional investors, on the other hand, have longer payback horizons. They value the predictable cash flow just as much as do telcos, but can afford to be more patient on payback.


Ongoing reductions in operating costs and complexity also play some role in lower breakeven points for connectivity provider access investments. Also, government support mechanisms can reduce deployment costs by as much as 30 percent, in some cases.  


Lumen reports its fiber-to-home average revenue per user at about $58 per month. For those of you who have followed fiber-to-home payback models for any length of time, and especially for those of you who have followed FTTH for many decades, that level of ARPU might come as a shock. 


Though some honest--and typically off the record--evaluations by some telco executives 25 years ago would have predicated the FTTH business model as “you get to keep your business” rather than revenue increases. 


Few financial analysts would have been impressed. 


The theory was that upgrading to FTTH would allow incumbent telcos to essentially trade market share with cable companies: gaining video subscription market share from cable as cable took voice share. The assumption was that home broadband share would remain about where it was. 


The thinking was that per-home revenue could range as high as $130 to $200 per month, even as overall market share was gained by cable and lost by telco providers. 


Econstor


In recent investor presentations, Frontier Communications has made three points about its prospects for revenue growth based on optical fiber deployments: the number of consumer broadband accounts; the number of businesses within 250 feet of existing fiber assets and the number of cell towers within one mile of Frontier fiber assets. 


Recent presentations also have shown fiber-to-home home broadband average revenue per user of about $63. 


source: Frontier Communications 


For at least some observers, the change in FTTH business model assumptions is stunning. Who would have thought FTTH projects would be undertaken when expected revenue per account was $50 to $70 a month?


AI Will Improve Productivity, But That is Not the Biggest Possible Change

Many would note that the internet impact on content media has been profound, boosting social and online media at the expense of linear form...