Saturday, April 8, 2023

Classic Platform Business Model Revenue Still a Science Project for Most Big Connectivity and Cloud Computing Firms

Network as a service, computing, storage or infrastructure as a service might easily be confused with a platform business model. After all, platform business models tend to involve use of remote or cloud computing, an application for ordering, provisioning, payments and customer service. So do many XaaS offerings. 


XaaS can provide value including reduced cost; greater agility and security that is maintained at industry leading levels. Sometimes XaaS also can provide advantages in terms of innovation or potential customer scale. 


But the difference in business models is not “buy versus build” or “virtualized” access, scale or innovation but the mechanism by which revenue is earned. A virtualized service offered by a “pipeline” business model provider is still an example of a traditional pipeline model: the seller creates the service and sells it to the customer. 


Amazon Web Services computing and storage functions, for example, are “sold as a service,” but that does not make those AWS products part of a platform business model. The Amazon Web Services Marketplace, on the other hand, is an example of a platform business model.


The marketplace supports transactions between third-party sellers to Amazon customers where Amazon earns a commission on each sale.


The general observation is that, at this point, though many firms are trying to add platform business model operations, those operations remain at a low level, compared to traditional pipeline operations. 


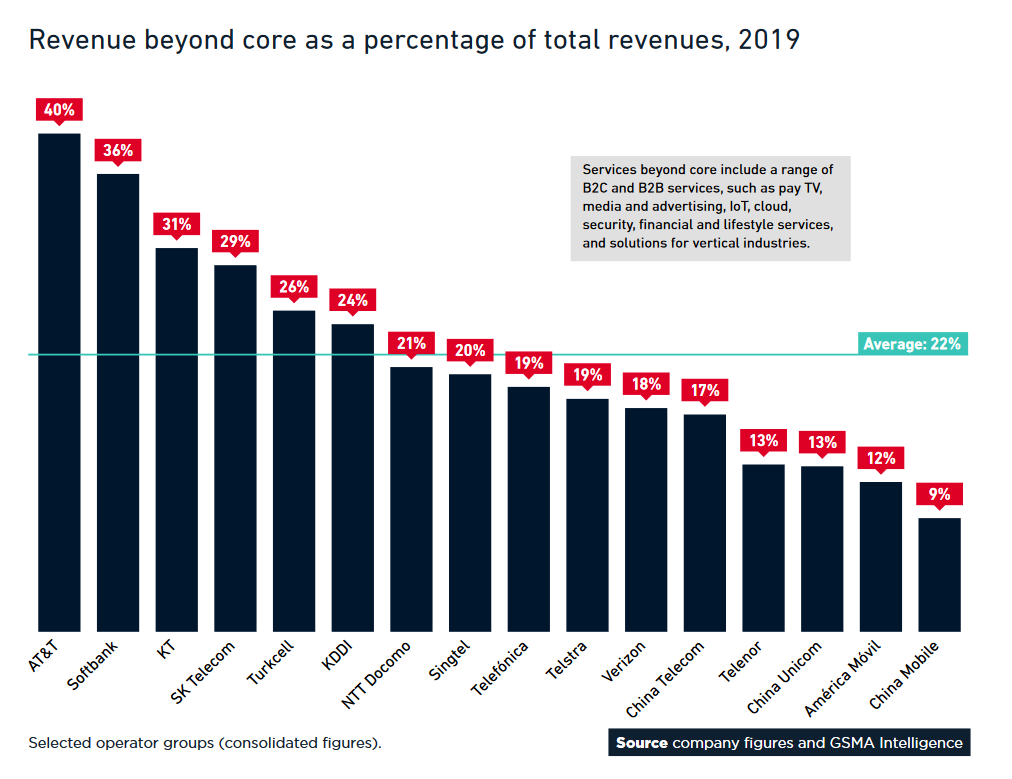
Classically, a platform earns revenue by earning a commission for arranging a match between buyer and seller. AT&T’s online marketplace, for example, allows third parties to offer internet of things products available for purchase from AT&T customers. 


AT&T also once hosted its own advertising platform Xander, which was sold to Microsoft. It allowed firms to place advertising on AT&T’s websites and apps. 


So far, revenue contributions have been small enough not to identify as distinct revenue streams. 


Likewise, Verizon once operated Verizon Media that placed ads on Verizon content assets, but that business was sold to Apollo Funds.


Some might consider the use of application programming interfaces evidence that a platform business model is in operation, but that is incorrect. APIs might be used to support a platform business model, but use of APIs, in and of itself, does not change the business model. 


APIs, though, are often a capability exploited by business model platforms, to connect users of the platform; to allow third-party developers to contribute value; to collect user data or to create revenue by charging fees for use of the APIs.


The GSMA Open Gateway initiative supporting APIs usable across networks supports a traditional pipeline model, where the firms create, support and sell their products directly to customers. 


So at least so far, few tier-one connectivity providers have shifted a significant portion of their operations to platform business models, or made it the key strategic direction. Recent asset dispositions by AT&T and Verizon suggest that approach remains experimental and non-core. 


Tuesday, April 4, 2023

Pulse FTTH in Loveland, Colo. Has Unusual Revenue and Cost Drivers

Loveland, Colo. fiber to home network Pulse--owned by the city’s water and power utility--began marketing in early 2022. The municipal-owned network projected first year revenues of $10 million and seems to have hit that milestone. The network expects to hit breakeven in its third year, which would be fast, compared to most other FTTH payback models. 


As always, there are caveats. Pulse early marketing has been aimed at business customers, with expected monthly charges ranging from $110 to $450 per month, substantially above the range of $50 to $70 a month typically charged for consumer accounts


Pulse also sells voice services to business customers, representing perhaps $50 a month in revenue per line. For consumers, Pulse sells video entertainment for prices ranging from about $38 a month up to $108 a month.  


Compared to most independent internet service providers, Pulse therefore has the ability to earn revenue from multiple services, not simply internet access. That has potential to boost per-account revenue, but also adds additional cost elements. 


Still, the Pulse revenue model has more drivers than home broadband. And ownership by the local power and water utility could, in principle, also mean lower costs.


The business plan is based on a 42 percent terminal take rate and a 32 percent business take rate. In practice, higher than expected build rates, lower than expected interest income and higher than expected infrastructure and equipment costs have caused some deviations from plan.    


The network should be fully built by the end of 2023, Pulse says.

Rogers Has about 60% Home Broadband Share, Leading 30% Share in Mobility

The completed merger of Rogers and Shaw does not really change the home broadband market share held by cable operators in Canada, but does create one new leader. The new firm likewise does not change the relative share of home broadband accounts held by cable operators in Canada, but does create a new industry leader, with about 60 percent share. 


source: Our Commons


That would be a dominating amount of share in any market. 


Likewise, the merger does not change the share of mobile phone accounts and share in Canada, either. But Rogers does emerge with slightly more share, roughly 30 percent, which is enough to make it the market leader in mobility share. 


source: Our Commons


Alibaba Breakup Illustrates Sum of Parts Valuation

Alibaba's impending breakup into six different companies sheds light on the valuation of conglomerate firms. The Chinese e-commerce giant is splitting into six distinct firms: Cloud Intelligence Group, Taobao Tmall Commerce Group, Local Services Group, Cainiao Smart Logistics Group, Global Digital Commerce Group and Digital Media and Entertainment Group. 


So the result would be firms focused on domestic e-commerce, cloud computing, international e-commerce and media, among others. The smallest unit might be conceptually related to X lab, Alphabet’s development unit. And there would be firms focusing on food delivery and logistics. 


Even as Alibaba carries a single valuation figure, no matter which metric is used, each of the six lines of business has a different set of potential metrics, based on existing market evaluations of media, e-commerce and cloud computing, for example. 


source: Reuters  


A sum of the parts valuation of the broken-up Alibaba, using a price/sales method, might 

Value Alibaba's core e-commerce business at $100 billion, while the cloud computing business is valued at $50 billion. 


The media business might be valued at about $25 billion, while the logistics unit is valued at perhaps $15 billion.


Using an EV/EBITDA method, Alibaba’s e-commerce business might be worth $250 billion, while the cloud computing business is valued at $100 billion. 


The media business might be worth about $50 billion, while the development unit is valued at about the same level. 


One might make the same observation about Amazon, which might be broken out into perhaps six distinct lines of business, each presumably also potentially valued differently from the other components. Growth rates, also a key factor in valuation, also differs wildly, from the online e-commerce growth rate of about two percent to the 20 percent growth of Amazon Web Services, 23 percent growth rate of advertising and 24 percent growth rate of third party fulfillment services. 


source: Deep Tech Insights 


source: Deep Tech Insights 


Some, such as Ben Alaimo of Deep Tech Insights, would value the e-commerce operations at a price/sales ratio of 2.4, while AWS is valued at a six times P/S ratio, for example. 


Other valuation metrics might include free cash flow generation, enterprise value or discounted cash flow. In 2022, for example, AWS might have had an EV/EBITDA ratio in the range of 43, while the rest of Amazon carried a ratio closer to 21. 


In 2022, AWS produced about $53 billion in free cash flow, while the rest of Amazon produced perhaps $14 billion. 


In 2022, AWS produced a bit more than twice the discounted cash flow as did the rest of Amazon. 


Alibaba's cloud computing operations do not produce as much value for that firm as Amazon Web Services does for Amazon. Cloud operations represent about nine percent of total revenue for Alibaba, while AWS constitutes about 16 percent of Amazon total revenue. 


AWS arguably represents all of the profit for Amazon, while cloud computing drives about 24 percent of Alibaba profit.


Cloud computing revenues are perhaps 22 percent of Microsoft revenue. It is unclear to me what percentage of profit cloud computing contributes. Google's cloud operations generate perhaps nine percent of total revenue, and nothing (yet) to Google profits. 


The point is that many firms in the media, software, online services and data center or access businesses are functionally conglomerates, with lines of business with distinct growth profiles, revenue contributions and profit margins. 


Blending all those sources shows the possible value of creating new pure play assets.


Monday, April 3, 2023

As an Asset Class, Infra is Infra: Valuation Envy is Pointless

Many observers would likely agree that a fiber to the home network costing about $1200 per location passed, with initial take rates of 20 percent, terminal take rates of 40 percent, featuring revenue of $60 per account, might reach breakeven in seven years or so, assuming borrowed money carries a four percent interest rate and full principal repayment after five years.


That would be a relatively quick breakeven point for other types of infrastructure investments. A new airport might reach breakeven in 10 to 20 years, some say. A new seaport, a new toll road or could well take that long as well. 


A new electrical generation plant, a natural gas utility or water system also might take that long to reach breakeven. 


The issue is what sort of investor can afford to make such investments? Many businesses simply cannot afford to wait that long for breakeven. Retailers or homebuilders might tolerate only six months to two years to reach breakeven. 


A new software company might need to reach breakeven in one to five years. Fixed or mobile communications networks might reach breakeven in five to 10 years, with seven years being a reasonable expectation, with a useful life of either type of network spanning as much as 20 years. 


Additional maintenance capital might be expected about every three to five years, however, which complicates the breakeven analysis. 


So it is possible, indeed likely, that the breakeven period for a communications network actually is similar to that of many other infrastructure investments, looking only at the mass market home broadband revenue driver. 


Most major ISPs would also say that additional cash flow is contributed by potential services for business customers, and some with mobile assets building small cell facilities would also point there for incremental value, even if not reflected in direct revenue contributions that can be measured. 


At some level, then, FTTH networks might have to be evaluated as most other infrastructure assets are: patient time perspectives, steady cash flow and competitive protections being parts of the valuation matrix. Value, not growth, in other words. Predictable cash flow rather than explosive revenue expansion; long term returns rather than short term. 


In other words, as much as some will hate the characterization, access networks are more like a utility than an application business. Network owners always are envious of the higher valuation multiples software and online assets command. 


But utilities and infrastructure simply are not those sorts of assets. Valuation envy can only be rationally satisfied if infrastructure owners become asset owners in those other businesses. And that is the argument behind “moving up the stack” or acquiring new roles within the value chain. 


The core access business, though, is what it is. Which is why new types of investors have emerged: digital infra is infra, with all that implies.


Is FTTH Some Form of "Greater Fool" Theory?

One has to ask whether some version of the “greater fool” investing approach applies to private equity and institutional investor positions in copper access networks that can be repositioned as optical access assets. 


That theory suggests an investor can make money buying overpriced assets so long as there are investors willing to pay an even-higher price. It works until there are no more “fools” left. 


The issue might be that payback models for today’s investors do not clearly seem to make sense on an operating basis. And fiber-to-the-home always has had marginal payback, even if strategically important. 


The most-shocking changes are the revenue assumptions for consumer locations. These days, the expected revenue contribution from a home broadband account hovers around $50 per month to $70 per month. Some providers might add linear video, voice or text messaging components to a lesser degree. 


But that is a huge change from revenue expectations in the 1990 to 2015 period, when $150 per customer was the possible revenue target. In some cases, revenue up to $200 per home location was considered feasible. 


To be sure, capital costs arguably have fallen to some extent. But most ISPs also operate in competitive markets, which increases the danger of stranded assets. 


And though ISPs might once have built their payback models on three potential revenue sources--voice, video entertainment and internet access--they now tend to base returns on one single service: consumer home broadband. 


To be sure, some ISPs also point to value for supporting small cell networks and upside from business customers. But one never sees detailed financial contributions from these areas in quarterly earnings reports. 


That suggests the contributions are indirect and hard to measure. 


“Our fiber ARPU was $61.65, up 5.3 percent year over year, with gross addition intake ARPU in the $65 to $70 range,” said John Stankey, AT&T CEO, of second quarter 2022 results. “We expect overall fiber ARPU to continue to improve as more customers roll off promotional pricing and on to simplified pricing constructs.”


Lumen reports its fiber-to-home average revenue per user at about $58 per month.


Recent presentations also have shown fiber-to-home home broadband average revenue per user of about $63. 


But assume for the moment that such additional value can be reaped. Why have potential investors other than connectivity service providers seemingly changed, bringing in financial investors from “outside” the ranks of service providers?


The clear argument is that digital instructure now is viewed as within the class of infrastructure investments that long have been favored by institutional investors. Digital infrastructure also is viewed as interesting by private equity firms that long have invested in underperforming or appreciating assets. 


Real estate and infrastructure investors are said to have different motivations for investing in each asset class. Real estate investment trusts, for example, traditionally are valued for their ability to produce income. 


Infrastructure offers predictable cash flow and business moats. But both assets also are supposed to offer diversification from asset risk related to concentration in stocks and bonds. 


On the other hand, both asset classes tend to be viewed similarly these days. Firms that invest in real estate also invest in infrastructure, including digital infrastructure such as cell towers, data centers and optical fiber networks. 


Private equity firms, which tend to invest in assets believed to be underperforming, tend to see similar opportunities in both real estate and infrastructure. Both asset classes are viewed as offering high financial returns. Both offer diversification for investment portfolios. 


Both are hedged against inflation and offer capital appreciation. Both are seen as supply-limited assets. And in recent days, some forms of digital infrastructure also benefit from government subsidy programs that reduce capital investment hurdles. 


And both types of assets are long-lived, capital intensive assets where leverage normally is required. 


We ultimately will see whether digital infrastructure winds up with some form of “greater fool” dynamic, in at least some parts of the sector. 


At the moment, payback from FTTH producing $50 to $70 monthly revenue from perhaps 40 percent to 45 percent of locations does not immediately suggest the FTTH capex produces a clear and interesting financial return. 


That might well be the case in areas where the first firm to deploy FTTH can reap take rates far higher than 45 percent. The payback might also be notable if wholesale access means the facility operator can count on both retail and wholesale market share. 


Such conditions arguably exist most often in rural markets, and less often in urban and suburban areas. Networks in rural areas are more expensive than networks built in urban and suburban areas, so payback seems to remain an issue in virtually all markets, even with government subsidies. 


The point is that some of us have yet to see payback analyses that are completely convincing where it comes to copper access networks intended for FTTH upgrades. Eventually we will find out. Let’s just hope some version of the greater fool theory is not operating. 


“Buy high, sell higher” works until there are no more buyers willing to “buy higher.”


Sunday, April 2, 2023

When Do "Non-Core" Revenues Reach a Level Suggesting a Firm has "Transformed" Itself?

AT&T once earned as much as 14 percent of its total revenue from “non-communication” services, mostly related to its linear TV subscription business, which the firm now has spun off to shareholders. 


Many “mobile operators” and “telcos” are looking to expand revenues from sources beyond the traditional connectivity services, according to GSMA. Some telcos in the Asia-Pacific region have gotten as much as 15 percent up to 50 percent of total revenues from non-communications products, according to Twimbit


 source: Twimbit


Before it spun off its linear video business, AT&T had booked as much as 40 percent of total revenue outside of core communications services and products. On average, larger telcos book as much as 22 percent of total revenue from sources outside their communications core. 


source: GSMA Intelligence 


source: GSMA   


Indices such as revenue from “non-core” sources is important for a number of reasons. It can show that “new product” progress beyond basic connectivity is possible. Growing revenue beyond the core also opens up the possibility that transformation also is possible. 


To the extent that connectivity providers want to grow beyond “access and transport” to provide all sorts of value that create new revenue upside, the percentage of “non-core” revenue matters.


For a few firms that might attempt a substantial “digital transformation,” the revenue contributors matter even more. If any connectivity provider can reach the point that more than half its revenues come from non-connectivity sources, we might argue that firm has transformed its business model.


CIOs Believe AI Investments Won't Generate ROI for 2 to 3 Years

According to Lenovo's third annual study of global CIOs surveyed 750 leaders across 10 global markets, CIOs do not expect to see clear a...