Tuesday, May 6, 2014

Google Fiber is Destroying its Competitors

Google Fiber has captured 75 percent share of high speed access homes it passes in certain medium-to-high income Kansas City neighborhoods, according to Bernstein Research. But even in the lower-income neighborhood surveyed, adoption of Google Fiber’s paid service seems to have reached 27 percent.


Should results such as those persist, Bernstein Research predicts that Google Fiber could attain and hold market share of perhaps 50 percent for its paid service, and about 10 percent penetration of its free service, within three to four years.


That would prove a difficult challenge for cable and telco Internet access and video service providers competing with Google Fiber, as it would imply that cable and telco ISPs collectively would have less than 50 percent share of high speed access market share.


In many markets, cable providers have 58 percent share, while telcos have 42 percent share. The Bernstein research also suggests Google Fiber quickly has grabbed seven percent to 15 percent video entertainment market share as well.


That implies cable could dip as low as 29 percent high speed access share in Google Fiber markets, while telcos could drop to 21 percent share. In addition, it is conceivable that cable TV and telco providers also could face a loss of perhaps 20 percent video entertainment market share as well.


In Wornall Homestead, the highest household median income neighborhood ($116,000 average household income) 83 percent of respondents were buying Google Fiber service.


Of those customers, 15 percent of homes were buying the $120 a month high speed access plus video subscription package.


About 53 percent opted for the $70 a month gigabit access service.


Also, some 15 percent had chosen to use the free 5 Mbps Internet access service.


In Community College, the neighborhood with the lowest household median income neighborhood ($24,000), 27 percent of homes were buying Google Fiber service.


About seven percent were buying the video-plus-Internet access package.


Some 19 percent have bought the 1 Gbps access service. Also, about seven percent of homes opted for the free access service.


In other potentially bad news for cable and telco competitors, all of the Google Fiber users indicated they would not buy a rival gigabit access service, presumably even when the rival service was offered at the same price as Google Fiber.


For some years, suppliers of high speed access service at 50 Mbps or 100 Mbps have encountered some resistance to such offers.


Google Fiber shows that the issue is the perception of value, compared to price. Google Fiber has not had similar resistance to a 1-Gbps service offered at $70 a month, less than most other ISPs had charged for the 50-Mbps services.


Should Google Fiber or other fixed network suppliers decide to build in a wider range of U.S. markets, both telcos and cable TV companies would face new pressures, including higher capital expense to match Google Fiber speeds, plus a new pricing umbrella that could drive prices of all slower speed offers downward.


That would create new pressures to reduce operating costs, as the option of raising prices to recover the bandwidth upgrades would be limited to impossible.

Observers will simply note that Google’s overall strategy has been to drive both device and Internet access prices lower, ensuring that virtually everybody uses Internet access, all the time, as that drives Google’s ad-supported application revenue model.

And Google Fiber is expanding its footprint.

Project Loon a Wholesale Provider to Mobile Companies?

Will Google become a wholesale provider of transmission infrastructure to mobile service providers in developing markets in the global south? It appears possible that could happen. 

Google's Project Loon, testing use of steerable balloons to provider Internet access across the global south, is looking at ways to lease its transmission platform to mobile service providers, as the balloons pass over areas those mobile service providers want to serve, in various countries. 

The advantage to mobile service providers is the new way to reach customers in areas not presently reached directly by mobile facilities. 

But wholesale also solves a significant problem Project Loon faces, namely access to enough spectrum, above each country, to supply reasonable amounts of Internet access. And that is a matter of how much spectrum Project Loon might have to work with.

Working as a wholesale provider of capacity to licensed mobile service providers would solve the spectrum access problem, in large part, while also potentially giving mobile service providers a fast way to create Long Term Evolution capacity, for example, in isolated regions. 

In principle, the balloon capacity also could be used as backhaul to mobile towers as well. 

U.S. Mobile Marketing War Finally Hits Verizon

It appears the U.S. mobile marketing war finally has caught up with Verizon Wireless. In fact, Verizon Wireless actually lost net contract customers for the first time in the first quarter of 2014.

Though mobile revenue was strong in the first quarter of 2014, Verizon Wireless also saw a sharp fall off in net new account activations, with most of the damage coming from feature phone and 3G accounts. One might speculate that most of those losses were to AT&T and T-Mobile US.

In fact, Verizon actually lost postpaid contract customers in the quarter, after gaining 1.6 million net postpaid accounts in the fourth quarter of 2013.

And though Verizon insists it will be “disciplined” in its approach to pricing and packaging attacks, Verizon already has started to respond, offering service discounts to customers who either buy a new device at full price or who bring their own device.

Despite the falloff in net subscriber gains, Verizon Wireless service revenue grew 7.5 percent, with profit margins up to 52.1 percent.

Total mobile segment revenues grew to $20.9 billion, up 6.9 percent.

Retail postpaid churn was 1.07 percent, up slightly, year over year, Verizon says.

Still, it is difficult to determine precisely how mobile phone share is changing in the U.S. market, in large part because a vast majority of actual new accounts in the market are connections of tablets, rather than phones.

But T-Mobile US is the clear winner in phone account market share.

Sprint and Verizon actually lost postpaid phone accounts in the first quarter of 2014, while AT&T gained about 312,000 net postpaid phone accounts.

T-Mobile US gained a net total of 1.8 million branded new accounts, including branded postpaid net additions of over 1.3 million. Only about 67,000 of those net adds were tablet connections. So T-Mobile US is the one service provider clearly gaining phone accounts.

In the first quarter of 2014, for example, Verizon Wireless, which had added more than two million net accounts in the fourth quarter of 2013, experienced a huge slowdown, adding just 539,000 net new accounts.

But note, Verizon actually lost 138,000 monthly postpaid phone customers in the first quarter. In other words, all of Verizon’s growth came from tablets, not phones.

AT&T gained about 625,000 net new postpaid accounts, of which about 313,000 were tablet connections.

The point is that account growth in the overall market was in the first quarter of 2014 driven by just two trends: T-Mobile phone gains and tablet connection gains at Verizon, AT&T and Sprint.

T-Mobile US, and to a lesser extent AT&T, were taking share of phone accounts while Verizon and Sprint were losing share.

To the extent there was net growth of subscribers at Verizon, it was because of tablet connections.

That suggests the T-Mobile US marketing attack is working, and that even Verizon, which had hoped to avoid losses, now has to react, as it also is losing phone market share.

The complicating factor is that two separate trends have to be separated, namely market share shifts in the crucial postpaid phone segment, as well as the growing connected tablet trend. “Net addition” trends, in other words, will have to be separated into phone and tablet accounts, to judge what is happening in terms of service provider market share.

That also applies to T-Mobile US expectations about its own market share growth. T-Mobile US CEO John Legere has suggested T-Mobile US, with 49 million customers, could reach 75 million subscribers in 12 months.  

That would require adding about 26 million net new subscribers, about 6.5 million a quarter, something no mobile service provider has done since perhaps 2008.

Ignoring for the moment prepaid subscriber accounts or average revenue per account or average revenue per user, Verizon has something more than 95 million postpaid contract accounts.

AT&T has more than 72 million. Sprint has about 30 million customers, while T-Mobile US serves something more than 22 million postpaid accounts.

But T-Mobile US serves as many as 47 million accounts, including prepaid accounts.

In the second quarter of 2013, Verizon had more than 118 million total subscriptions in service, while AT&T had nearly 108 million. Sprint had more than 53 million.

Were T-Mobile US to even approach 75 million total accounts, it is likely that gains would be driven by prepaid and tablet net new additions.

On the other hand, if current net additions trends continue, T-Mobile will pass Sprint, for the first time, to take the third position for U.S. mobile market share, within a year.

But mobile share increasingly is not the same thing as phone postpaid accounts, phone accounts including both postpaid and prepaid accounts. And that means future analysis of U.S. mobile market share will have to pay attention to phone and tablet accounts, in addition to postpaid and prepaid accounts.

Those changes in device net adds will have revenue per device implications. There always is an important difference between postpaid and prepaid accounts. Now it also appears net subscriber growth is being driven by tablets, not phones.

That is significant because average revenue per device is going to be lower than if the new additions were phone accounts.

So far, T-Mobile US subscriber gains have not seemed to dent net growth at AT&T, but principally because net additions are driven by tablet connections.

It is likely AT&T has been losing phone subs to T-Mobile US. Only in the first quarter of 2014 does T-Mobile US seem to have taken subscribers from Verizon.

Mobile Dominates Both Broadband Access and Voice, Globally

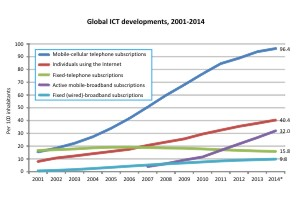
Mobile voice subscriptions now outnumber fixed voice connections about six to one, globally, and
about 76 percent of all Internet access connections globally use mobile connections, according to the International Telecommunications Union.

In other words, mobile is the dominant way most people use either voice or Internet access. At the same time, the percentage of people who actually buy voice service from a fixed network is declining, both in developed and developing markets.

Those facts have implications for revenue growth, capital investment and business strategy,
shaping not only “who” is in the business but “how” they approach the business and “where” the revenue growth is, which services are growing and which are declining.
In the U.S. market, for example, revenue growth has shifted to mobile segment, with one important exception.

AT&T and Verizon are seeing revenue growth in their fixed network segment, on the strength of high speed access services and video entertainment.

Google Fiber likewise anchors its service with gigabit high speed access service, complemented with video entertainment. Note that Google Fiber does not offer branded voice service. To be sure, Google has said it would have offered voice service, were the regulatory burdens not so high.

Still, Google Fiber shows that high speed access and video entertainment are the lead apps for a fixed network business.

Even smaller telcos, despite losing money overall, are seeing growth in high speed access services.

In the first quarter of 2014, for example, Fairpoint data and Internet services revenue grew nearly 11 percent, year over year, from $14.9 million to $19.9 million, largely on the strength of services sold to business and organization customers.

Data and Internet services revenue also increased sequentially in the first quarter, for the fifth consecutive quarter, Fairpoint Communications says.

Voice access lines. on the other hand, declined 6.8 percent year-over-year as compared to 7.8 percent decline a year ago.  

That provides just one example of a change in the value of a fixed access network. Whether a fixed network service provider is Google Fiber, Fairpoint Communications, AT&T or Verizon, value increasingly is anchored in high speed access, with video entertainment being the important second app.

Among the possible ramifications of U.S. industry consolidation that could happen were regulatory authorities to approve Comcast’s purchase of Time Warner Cable, an AT&T bid for DirecTV and a Sprint acquisition of T-Mobile US, not to mention any others that also could follow in the immediate wake of such restructuring, is impact on high speed access services.

Comcast would become the largest supplier of consumer high speed access in the United States. AT&T might be able to devote most of its fixed network bandwidth to Internet access services. And Sprint might find it has to re-enter the fixed network Internet access business, as a condition of getting approval for its mobile merger.

Still, overall, since global  revenue and subscriber growth is driven by mobile services, not fixed network services, capital investment will skew towards mobile networks as well, as each incremental unit of fixed network investment produces less incremental revenue than a similar unit of investment in mobile assets.

But the shift in value for fixed networks is clear. In a new twist, fixed Internet access networks provide value as a key way to backhaul mobile Internet traffic.

In some cases, up to 80 percent of mobile traffic is offloaded to Wi-Fi networks, for example.

And fixed network coverage is likely to remain rare. By the end of 2014, fixed broadband penetration will reach about 10 percent of homes globally.

And as consumers seem to be abandoning fixed network voice services in both developing and developed regions, additional investment in new fixed networks is likely to remain limited, wherever it does not already exist.

Some 44 percent of all fixed broadband subscriptions are in Asia and the Pacific, and 25 percent are in Europe. So 69 percent of fixed broadband connections are in those two regions.

In contrast, Africa accounts for less than 0.5 per cent of the world’s fixed broadband subscriptions, and despite double-digit growth over the last four years, penetration in Africa remains very low.

Africa, the Arab States, and CIS are the only regions with double-digit fixed broadband penetration growth rates.

The Americas region stands out with the lowest growth in fixed broadband penetration, estimated at 2.5 per cent and reaching a penetration rate of around 17 per cent by end 2014.

Europe’s fixed broadband penetration is much higher compared with other regions and almost three times as high as the global average.
source: ITU

The point is that the value of fixed networks has to change: such networks cannot provide value as voice vehicles. Instead, high speed access and mobile network offload, plus video entertainment, are emerging as the long-term value of fixed networks.

But where fixed networks operate, revenue growth will be driven by Internet access services.

By the end 2014, there will be almost three billion global Internet users, 66 percent of which live in the developing world.

But mobile networks will supply 2.3 billion of those total connections, or about 77 percent of all Internet access connections.

ITU statistics on mobile broadband for 2014By way of contrast, there were at the end of 2013 about 1.16 billion fixed voice lines in service, according to the International Telecommunications Union. More importantly, the ITU suggests fixed telephone penetration has been declining for the past five years.

The ITU data suggests there will be about 700 million fixed network high speed access lines in service, or about 60 percent of the number of voice lines. Over time, that percentage is going to grow, at least in part because voice now has shifted to mobile networks.

There will be, at the end of 2014, about seven billion mobile phone users. Some 3.6 billion of these will be in the Asia-Pacific region, and the developing world will account for 78 percent of the world’s total mobile subscribers.

In Africa and Asia and the Pacific, mobile penetration will reach 69 percent and 89 percent, respectively in 2014.

Penetration rates in the CIS, Arab States, the Americas and Europe have reached levels above 100 percent and are expected to grow at less than two percent in 2014.

But even mobile connections are shifting in the direction of adding mobile Internet access. Globally, mobile broadband penetration will reach 32 percent by end 2014; in developed countries, mobile broadband penetration will reach 84 per cent.

In developing countries, mobile broadband adoption will be 21 percent.

Mobile broadband penetration levels are highest in Europe (64 percent) and the Americas (59 percent), followed by CIS (49 percent), the Arab States (25 percent), Asia-Pacific (23 percent) and Africa (19 percent), the ITU says.

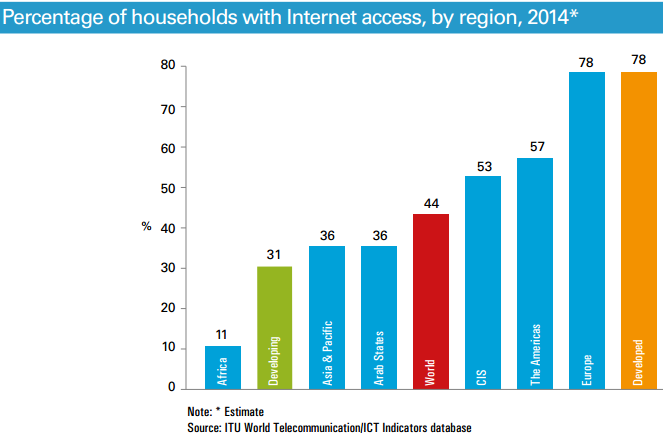
By end 2014, 44 percent of the world’s households will have Internet access. About 31 percent of households in developing countries will be connected to the Internet, compared with 78 percent in developed countries.

More than 90 percent of the people who are not yet using the Internet are from the developing world.

In Africa, almost 20 percent of the population will be online by end 2014, up from 10 per cent in 2010.


Monday, May 5, 2014

"Freedom for Me, Regulation for Thou"

“Permissionless innovation” is one way of describing the reason innovation in the Internet app space has been so rapid.

But some might argue that freedom for me, regulation for you is the way beneficiaries of “permissionless innovation” want providers of enabling services to be treated. To be sure, every business, and every industry, has vested interests where it comes to each specific revenue and business model.

The other way of putting this is to note that every business wants high prices for its own products, and low prices for all the inputs it sources from ecosystem partners.

That is why many application industry executives want the U.S. Federal government to regulate Internet access in ways that essentially would limit market prices and revenue models for the providers of a key Internet revenue model input.

Expecting industries and firms to do otherwise is unrealistic. But our history with highly-regulated access services does not offer lots of hope that innovation will be high, and prices competitive, under such conditions.

Some will argue that such outcomes were produced by highly-regulated but monopolistic access markets, but will not apply to highly-regulated suppliers in competitive markets.

Some might argue this is tantamount to arguing that managed information services should be regulated.

That is a key concept, as it essentially attempts to revise the historic treatment of traditional data services, which have been considered unregulated information services.

Generally speaking, the trend in regulatory thinking has been not to regulate, or regulate with a light touch, managed services and information services. Cable TV, over a process of 50 years, has been treated in an oscillating way, sometimes more regulated, sometimes less regulated.

But the main trend has been deregulatory. Network-delivered satellite video has tended to benefit even more than cable TV providers have, in such matters. Telcos tend to be covered by most of the rules applying to cable TV entities.

Recently, with the advent of Google Fiber, local regulators have tended to want to relax rules to entice Google Fiber to build networks, not requiring network facilities to be built citywide, for example, but allowing spot builds only in parts of a city or community.

“Permissionless innovation” has worked very well. One might argue it also would provide benefits in the access services business as well, even if some for whom such service otherwise would be a cost of doing business, it could raise the cost of doing business.

What is Happening with Service Provider Mobile Phone Market Share?

It is difficult to determine precisely how mobile phone share is changing in the U.S. market, in large part because a vast majority of actual new accounts in the market represent connections of tablets, not phones.

But T-Mobile US is the clear winner in phone account market share.

Sprint and Verizon actually lost postpaid phone accounts in the first quarter of 2014, while AT&T gained about 312,000 net postpaid phone accounts.

But T-Mobile US gained a net total of 1.8 million branded new accounts, including branded postpaid net additions of over 1.3 million. Only about 67,000 of those net adds were tablet connections.

In the first quarter of 2014, for example, Verizon Wireless, which had added more than two million net accounts in the fourth quarter of 2013, experienced a huge slowdown, adding just 539,000 net new accounts.

But note, Verizon actually lost 138,000 monthly postpaid phone customers in the first quarter. In other words, all of Verizon’s growth came from tablets, not phones.

AT&T gained about 625,000 net new postpaid accounts, of which about 313,000 were tablet connections.

The point is that account growth in the overall market was in the first quarter of 2014 driven by just two trends: T-Mobile phone gains and tablet connection gains at Verizon, AT&T and Sprint.

T-Mobile US, and to a lesser extent AT&T, were taking share of phone accounts while Verizon and Sprint were losing share.

To the extent there was net growth of subscribers at Verizon, it was because of tablet connections.

That suggests the T-Mobile US marketing attack is working, and that even Verizon, which had hoped to avoid losses, now has to react, as it also is losing phone market share.

The complicating factor is that two separate trends have to be separated, namely market share shifts in the crucial postpaid phone segment, as well as the growing connected tablet trend. “Net addition” trends, in other words, will have to be separated into phone and tablet accounts, to judge what is happening in terms of service provider market share.

That also applies to T-Mobile US expectations about its own market share growth. T-Mobile US CEO John Legere has suggested T-Mobile US, with 49 million customers, could reach 75 million subscribers in 12 months.  

That would require adding about 26 million net new subscribers, about 6.5 million a quarter, something no mobile service provider has done since perhaps 2008.

Ignoring for the moment prepaid subscriber accounts or average revenue per account or average revenue per user, Verizon has something more than 95 million postpaid contract accounts.

AT&T has more than 72 million. Sprint has about 30 million customers, while T-Mobile US serves something more than 22 million postpaid accounts.

But T-Mobile US serves as many as 47 million accounts, including prepaid accounts.

In the second quarter of 2013, Verizon had more than 118 million total subscriptions in service, while AT&T had nearly 108 million. Sprint had more than 53 million.

Were T-Mobile US to even approach 75 million total accounts, it is likely that gains would be driven by prepaid and tablet net new additions.

On the other hand, if current net additions trends continue, T-Mobile will pass Sprint, for the first time, to take the third position for U.S. mobile market share, within a year.

But mobile share increasingly is not the same thing as phone postpaid accounts, phone accounts including both postpaid and prepaid accounts. And that means future analysis of U.S. mobile market share will have to pay attention to phone and tablet accounts, in addition to postpaid and prepaid accounts.


U.S. Mobile Subscriber Share
Q2 2013 (ranking by subscribers, retail + wholesale)
source: Strategy Analytics
Carrier
Subscribers (millions)
1
118.194
2
AT&T
107.884
3
Sprint
53.258
4
T-Mobile US
44.016


How Long Will U.S. Mobile Price War Last?

No price war ever lasts forever, in the communications business. So one might well ask how long the present U.S. mobile price war will last, though some might argue there is no real price war going on.

A reasonable expectation might be that we are less than half way through, with an ultimate duration of about two years of unusual efforts at price disruption, to be followed by a period when the leading contestants have adjusted enough to show they can weather the attack, and the attacker or attackers find they have gained share, but now have to switch to improving profits.

But that forecast also assumes no other major changes in U.S. market conditions, including such mundane occurrances as a major economic recession, major changes in regulatory policy or major merger activity in other parts of the communications market that intensify or diminish the importance of the mobile price war and market share positions.

One might also argue the price war will last as long as T-Mobile US believes it should continue to attack. So long as T-Mobile US can continue to add a couple million net new customers every quarter, the war is likely to continue.

If the rate of net additions starts to flatten, then T-Mobile US will have to begin weighing a shift in strategy from price disruption to earning profits. Right now it is too early to say T-Mobile US has any reason to change course.

In fact, T-Mobile US might actually believe its rate of net additions is about to escalate.

What matters is the impact on consumer welfare and supplier strength, after such a price war. Ironically, even if number-four T-Mobile US has launched an attack aiming to vault higher in the market share rankings, history suggests the effort could well end with stronger positions for Verizon and AT&T.

Ironically, a price war launched by an upstart often ends with the top firms in a more dominant position. The reason is simply that price wars hit profit margins and gross revenue per account, something a leading service provider can afford to absorb.

Often, smaller providers simply find they are unable, at some point, to maintain profits at all, and go out of business, or are absorbed.

Also ironically, regulator and policy maker efforts to sustain a market structure with four national providers, to provide competition, however successful in the short run, likely will fail in the long run.

The argument is that any mergers between the two smaller U.S. mobile service providers should be opposed because such a move would reduce competition. But market forces alone, under conditions of a price war, will weaken both the smaller firms. True, earnings will be pressured at the two bigger carriers as well.

But AT&T and Verizon have the financial strength to take the blows. Sprint and T-Mobile US ultimately are likely not to withstand the financial pressure.

Price wars, typically launched by smaller and upstart firms, tend to reduce average revenue per account, even if generating more gross revenue.

Eventually, that tends to lead to most of the smaller firms disappearing, either through acquisition by other larger firms or bankruptcy.

Consumer welfare might also be worse, eventually, as the additional competitors leave the market.

The present price war launched by T-Mobile US therefore will not last forever, and the issue is what market structure will remain when the war ends.

Though U.S. antitrust authorities and communications regulators might well oppose any merger between Sprint and T-Mobile US, the ultimate result is likely to be no more than three larger competitors, under any circumstances.

Verizon and AT&T still will be the largest firms in the market. The surviving third carrier is likely still to be twice as small, in terms of subscribers or revenue, as either AT&T or Verizon. Nor would it be implausible that, eventually, the top provider could gain share double that of the second provider, while the second provider (in terms of market share) has double the share of the third provider.

Some idea of what could happen is provided by the French mobile market, which has endured a two-year price war, ignited by Illiad’s Free Mobile.

And Orange CFO Gervais Pellissier thinks the French mobile price war that began in January 2012 is about to taper off.

"We are maybe not totally out of the tunnel but we do see positive trends," Pellissier said.

To be sure, Orange has had to cut costs to hold profit margins steady on lower sales because of the price war. In its most-recent quarter, Orange earnings fell about 3.8 percent, but profit margins were steady at about 31 percent.

But that is the point: Orange seems to have survived the war. Illiad has gained share, but even Illiad might be reaching a point where it now wants to turn attention to profits, rather than market share gains.

DIY and Licensed GenAI Patterns Will Continue

As always with software, firms are going to opt for a mix of "do it yourself" owned technology and licensed third party offerings....