Thursday, August 20, 2015

Will Carriers Ever Regain Some of Their App Creation Role?

The “triumph of hope over experience”is one way to describe thinking that communications access or transport  providers can substantially regain the app-creating role they once had in the telecom business.

That is not to say some gains can be made. That is one reason many service providers are enthusiastic about Internet of Things and machine-to-machine services. The real upside does not appear to be in the value of “access” subscriptions, but in the value of the services that use the connections.

In other words, the real money will be made in providing the monitoring and telemetry services, not the network access. The consumer analogy is Netflix. The value is providing the actual application and service, not the incremental value of the Internet access necessary to use the app.

Broadly speaking, that is the difference between carrier voice, messaging and video entertainment services, and Internet access. Internet access if, by definition in most markets, a classic dumb pipe service.

It is vital and necessary, but still a dumb pipe product--it provides the connection to things people want to do, not the “things” themselves.

For at least two decades, it has been true that most apps are created by third parties. There is a good reason: the Internet Protocol ecosystem mandates such separation of apps and access.

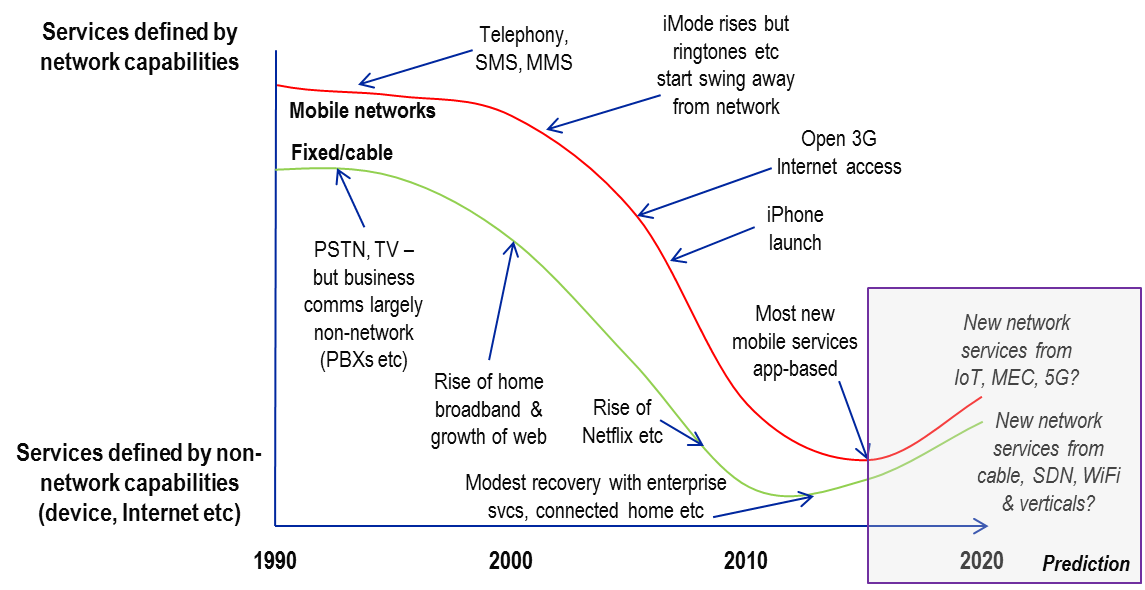
Yet hope remains that in developing new arenas, it might yet be possible to recreate a carrier role in creation and delivery of services and apps.

It is possible, perhaps even likely. Whether a fundamental change in application development will happen is debatable.

The IP ecosystem encourages, indeed mandates, app development that is completely separated from the provision of network access. To be sure, carriers can create apps and bundle them with access.

But it seems highly unlikely carriers can hope to create more than a relative handful of valuable and revenue-generating new apps.

As the saying goes, no matter how many smart people work for your company, most of the smart people in the world work for somebody else.

In other words, the sheer volume of potential app developers means no single carrier or firm can hope to create many more than a relative handful of the most-successful apps and services.

It would be in keeping with history to argue that if and when carriers become suppliers of some key apps, it mostly will be because they acquired those capabilities from others.

That’s not a criticism. It will always be the case that most of the significant app innovation happens somewhere else, by design and circumstance. That is the way innovation is supposed to work in an IP ecosystem.


OTT Messaging Used by 36% of U.S. Smartphone Users

Some 36 percent of U.S. smartphone owners report using messaging apps such as WhatsApp, Kik or iMessage, and 17 percent use apps that automatically delete sent messages such as Snapchat or Wickr, according to the Pew Research Center.

Nearly half (49 percent) of smartphone owners ages 18 to 29 use messaging apps, while 41 percent use apps that automatically delete sent messages.

“These apps are free, and when connected to Wi-Fi, they do not use up SMS (Short Messaging Service) or other data,” says the Pew Research Center.

Globally, more than half of mobile users are active users of such over the top messaging apps. Message volume tells the story: since 2013, OTT message volume has rapidly outpaced carrier-provided text messaging.

Predictably, that has had an effect on SMS revenue.


India Mobile Revenue Up 15% in 2015

Mobile connections in India will grow to 880 million in 2015, a five  percent increase from 837 million connections in 2014, according to Gartner.

Spending (in constant U.S. dollars) on mobile services will grow four percent to reach $21.4 billion in 2015, driven by mobile Internet services.

Spending on mobile services will be driven by data services, which is expected to grow 15 percent to reach $6.5 billion in 2015.

A large chunk of this growth will be driven by the increasing use of cellular services on data-centric devices, such as tablets and notebooks, through either embedded cellular modems or USB sticks, Gartner believes.

China's Smartphone Market is Saturated

Global smartphone sales grew at the slowest growth rate since 2013 in the second quarter of 2015, according to Gartner.

Worldwide sales of smartphones to end users totaled 330 million units, an increase of 13.5 percent over the same period in 2014.

Emerging Asia/Pacific (excluding China), Eastern Europe and Middle East and Africa were the fastest-growing regions.

But smartphone sales in China fell for the first time year over year, recording a four percent decline.

"While demand for lower-cost 3G and 4G smartphones continued to drive growth in emerging markets, overall smartphone sales remained mixed region by region in the second quarter of 2015," said Anshul Gupta, research director at Gartner. "China has reached saturation — its phone market is essentially driven by replacement, with fewer first-time buyers.”

"China is the biggest country for smartphone sales, representing 30 percent of total sales of smartphones in the second quarter of 2015.

Worldwide Smartphone Sales to End Users by Vendor in 2Q15 (Thousands of Units)
Company
2Q15
Units
2Q15 Market Share (%)
2Q14
Units
2Q14 Market Share (%)
Samsung
72,072.5
21.9
76,129.2
26.2
Apple
48,085.5
14.6
35,345.3
12.2
Huawei
25,825.8
7.8
17,657.7
6.1
Lenovo*
16,405.9
5.0
19,081.2
6.6
Xiaomi
16,064.9
4.9
12,540.8
4.3
Others
151,221.7
45.9
129,630.2
44.6
Total
329,676.4
100.0
290,384.4
100.0
Source: Gartner (August 2015)

Wednesday, August 19, 2015

LTE-U Offers Indirect and Direct Revenue Upside Potential

As always is the case, contestants in the telecom services business will use tools in ways viewed as helpful to their revenue models. Upstarts trying to take market share are more likely to try disruptive tactics. Market leaders are more likely to seek ways to directly monetize new technologies and platforms.

In other words, attackers are likely to “give away value and features” if it helps them grow share, while leaders are more likely to want to try and charge for new value and features to directly boost average revenue per account.

Ways to bond capacity from mobile--Long Term Evolution (4G) and coming fifth generation (5G)--are likely to follow that pattern.

T-Mobile US, for example, already is exploring ways to use pre-standard Long Term Evolution aggregation of mobile and Wi-Fi assets. In part, that is because T-Mobile US arguably has fewer assets in the network coverage area, compared to AT&T and Verizon.

So bonding its mobile network assets with any available Wi-Fi will improve user experience, giving customers an experience equivalent to, or better than, having a mobile network infrastructure that is more developed (capacity and geographic coverage).

As would any challenger, T-Mobile US might see bonding of mobile and Wi-Fi assets as a way to monetize the feature indirectly, in the form of greater customer numbers. Other providers are more likely to try and monetize more directly, such as by charging all access--mobile or mobile plus Wi-Fi--as coming out of the mobile data usage allocation.

Use of Wi-Fi alone, as when a user switches to Wi-Fi access instead of mobile, would continue to be unaffected by the capacity aggregation techniques.

Billing Implications of LTE-U, MuLTEfire or LAA?

The current interest on the part of mobile operators to combine access assets across Wi-Fi and Long Term Evolution and all subsequent mobile networks (fifth generation and beyond) might turn on billing rather than technology or regulatory issues.

Offload of mobile device traffic to Wi-Fi generally is seen as a positive by mobile operators, as it often results in better user experience, while not debiting mobile data allowances.

The ability to combine mobile and Wi-Fi access assets might turn on the potential revenue upside, however. Compared to a scenario where users switch to Wi-Fi for access, not using the mobile network at all, Long Term Evolution-Universal (license assisted access or Qualcomm’s MulLTEfire) could represent some incremental ability on the part of a mobile service provider to directly bill for Wi-Fi usage.

Of course, that also was the hope when mobile operators launched Long Term Evolution as well, so nothing is assured. As it turned out, operators generally are unable to charge any premium for LTE access, compared to 3G.

It might turn out that most consumers continue to simply switch to Wi-Fi, whenever possible, rather than relying on mobile network access.

Winning by Losing or Losing by Winning?

Perhaps this is what winning now looks like, for many service providers: flat revenue, declining earnings and negative operating income. Seriously.


In part, that is viewed as a positive because operating metrics improved, ranging from strong growth of video subscriptions, high speed access and bundled services revenue.


“Despite price cuts for roaming services, currency effects and strong competition, we enjoyed a solid and pleasing result in the first half of the year,” said Swisscom CEO Urs Schaeppi.


Most of those results come in the “units sold” or “next generation services provided” area.


As at the end of June 2015, Swisscom had connected more than 2.5 million homes and businesses to ultra-fast broadband with speeds in excess of 50 Mbps.


By the end of 2016, 99 percent of the Swiss public should have access to bandwidths of up to 150 Mbps. Swisscom also is currently testing 4G/LTE bandwidths of up to 450 Mbps, which are expected to go on offer at the end of 2015.


Roaming data traffic accelerated as a result of a drop in prices. In the first half of the year, volumes rose by a factor of 2.3 in comparison with 2014, and tripled in July.


By the end of June 2015, the number of customers using a bundled package had increased year-on-year by 197,000 or 17.7 percent  to 1.31 million.


Revenue from bundled contracts rose year-on-year by CHF 168 million or 18.5% to CHF 1,077 million.


The number of Swisscom TV connections increased year-on-year by 147,000 or 13.5 percent to 1.2 million (+73,000 in the first half of the year).


The number of retail fixed-line broadband connections  increased 67,000, year over year, up 3.6 percent to 1.92 million.


The growth of TV and broadband connections more than offset the decline in the number of fixed network connections (-133,000 year over year). The number of revenue generating units (RGUs) increased year-on-year by 192,000 or 1.6 percent to 12.4 million.


Swisscom First Half 2015 Financial Results
Net revenue (in CHF million)
5,700
5,758
1.0%
Operating income before depreciation and amortisation, EBITDA (in CHF million)
2,182
2,133
-2.2%
Operating income EBIT (in CHF million)
1,160
1,105
-4.7%
Net income (in CHF million)
806
784
-2.7%


Swisscom First Half 2015 Operating Metrics
Swisscom TV access lines in Switzerland (as at 30 June in thousands)
1,091
1,238
13.5%
Mobile lines in Switzerland (as at 30 June in thousands)
6,460
6,571
1.7%
Revenue from bundled contracts (in CHF million)
909
1,077
18.5%
Broadband lines Fastweb (as at 30 June in thousands)
1,994
2,157
8.2%

Are ISPs Overselling the Value of Higher Speeds?

In the communications connectivity business, mobile or fixed, “more bandwidth” is an unchallenged good. And, to be sure, higher speeds have ...