Thursday, February 3, 2022

A Handful of Hyperscale App Providers Drive Global Bandwidth

There is a simple reason why hyperscale app providers now drive global data traffic and build and own their own networks: a handful of firms generate most of the demand. In 2021 just six firms generated 57 percent of global traffic. 


source: Sandvine, IN Forum


These days, voice demand is paltry in relation to content bandwidth--largely video--that flows between hyperscale application provider data centers and internet points of presence where local internet service provider traffic pours onto the backbones. 


In other words, if you know the locations of the hyperscale app provider data centers, you also know the locations between which most data flows over WANs. 


source: Telegeography 


source: Telegeography 


Global Internet Bandwidth Grows 29% in 2021

Global internet bandwidth usage spiked 34 percent from 2019 to 2020 and a further 29 percent in 2021 to 786 Terabits per Second (Tbps), says Sandvine


“We expect the average household to use as much as 650  gigabytes to 750 gigabytes per month by the end of 2021,” Sandvine notes. Video and game content is fueling power user behavior. 


“In fixed network data, we are seeing an increase in 1 terabyte per month power users,” Sandvine says. “The heaviest users spent time on XBOX Live Video, Microsoft Outlook 365, Netflix, PS4 Games downloads, Discord, Twitch, and BitTorrent.”


And the “big six” share of traffic is growing.


source: Sandvine  


What You Do When it Was -7 Degrees Fahrenheit Last Night


This is one of the cats who regularly visits my backyard. I'm not sure whether it is a stray or abandoned cat, but am certain he is not feral (he has interacted with humans in the past; feral cats grew up "wild" with no close human interaction). He could be owned by a neighbor, but allowed to roam outdoors at night, or when it is quite cold, something I would not do. 

I always keep water and food out there, just in case, plus a cat shelter. I've done so for decades, everywhere I've lived, just in case. He's huddling up in the early morning sunshine trying to get warm. 


Analysts Signal Belief that Home Broadband is a Material Revenue Driver for T-Mobile


There were lots of questions from equity analysts about fixed wireless on T-Mobile's fourth quarter 2021 earnings call. That is evidence that home broadband is expected by analysts to become a material contributor to T-Mobile's revenue and earnings. 

Perhaps most surprising is the revelation that “the majority of our customers come from suburban and urban markets,” according to Dow Draper, T-Mobile EVP. T-Mobile--and most observers--might have guessed adoption would be driven by rural account additions.

Wednesday, February 2, 2022

Will FTTH Payback Always be Led by Internet Access Revenues?

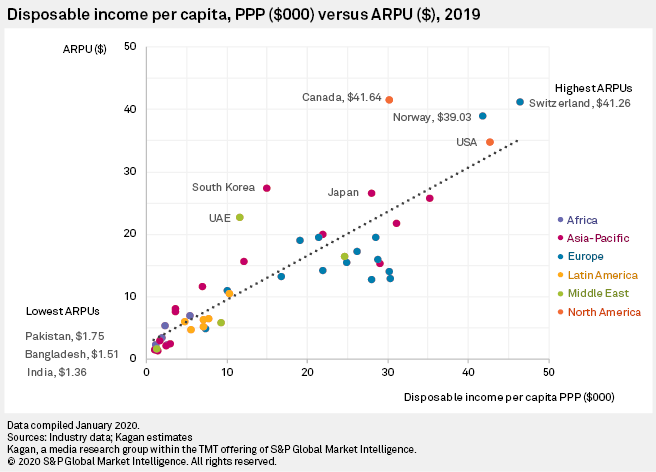
Retail mobile and fixed network connectivity providers who sell directly to consumers arguably face some issues related to average revenue per account and cost per account. Whether in the mobile or fixed realms, mobile revenue per account seems to range from a few dollars a month up to $41 per month. 

source: S&P Global Market Intelligence 


Against that must be balanced the cost of infrastructure, operating and marketing costs plus all other overhead, ranging from personnel benefits to debt service and taxes. While not minor, network infrastructure costs are only part of the cost model. 


Some have claimed 5G can reach break even in a five years or less. But that likely rests on excluding all other business costs except the network infrastructure. 5G capex per subscriber might range between $100 and $450 per year, during the network build period. 


Even assuming a 20-percent profit margin, that still means 80 percent of revenue is consumed by operating costs, marketing, amortization of debt and other overhead, including personnel costs, retirement fund payments, dividend payments, taxes and so forth. 


Looking at internet access prices using the purchasing power parity method, developed nation prices are around $35 to $40 a month. In absolute terms, developed nation prices are less than $30 a month. 


That PPP normalization technique compares prices to gross national income per person. There are methodological issues when doing so, one can argue. 


Gross national income is not household income, and per-capita measures might not always be the best way to compare prices, income or other metrics. But at a high level, measuring prices as a percentage of income provides some relative measure of affordability. 


Generally speaking, broadband prices are dropping in developing countries, where the product is most expensive, and primarily because mobile internet access prices are dropping. 


source: ITU 


Looking at mobile voice and data prices, as a percentage of gross national income per person, one easily can see that very-high prices in lesser-developed countries skew global indices. In some developed markets, prices are less than one percent of GNI (without adjusting for purchasing power parity). 

source: ITU 


The unadjusted 2019 average price of a broadband internet access connection--globally--was $72..92, down $0.12 from 2017 levels, according to comparison site Cable. Other comparisons say the average global price for a fixed connection is $67 a month. 


Looking at 95 countries globally with internet access speeds of at least 60 Mbps, U.S. prices were $62.74 a month, with the highest price being $100.42 in the United Arab Emirates and the lowest price being $4.88 in the Ukraine. 


Another study by Deutsche Bank, looking at cities in a number of countries, with a modest 8 Mbps rate, found prices ranging between $50 to $52 a month. 


The point is that network infrastructure investment now seems to hinge on revenue--depending on how we count it--that could range from a few dollars a month up to perhaps $72 a month. 

Most of the market--with prices adjusted for currency and living standards--seems to be $40 a month or less. 

That is challenging for fixed network operators deploying fiber to the home, if less a challenge for mobile operators, whose networks cost less, per customer or passing. 

Among countries that are members of the Organization for Economic Cooperation and development, prices prices in 2016 seemed to cluster around $40 per month. 

A more recent study confirmed those figures. 

The take away is that FTTH payback--in many markets--cannot rest solely on home broadband revenues. Other revenue drivers likely must also contribute. Right now, that includes backhaul for 5G and future mobile networks, internet of things, edge computing, internet of things and applications that are owned by the connectivity providers. 

Over time, those other sources might be even more important. Payback models of several decades ago assumed significant contributions from sources such as voice and video entertainment that have declined steadily. 

The net change is a revenue-per-account ranging from $130 per month to $200 a month to the present $40 to $50 a month level. FTTH costs per passing have gotten better, but probably not enough to support revenue as low as $40 a month or even $50 a month. 

Other value must be involved, or the payback model is not there. 

Are Mobile-Plus-Fixed Bundles on the Verge of Marketing Push?

If a projection by the European Telecom Network Operators’ Association proves to be accurate, and if it is mirrored in some other markets, a growing portion of the consumer market will be amenable to buying both mobile and fixed network services as a bundle. 


Basically, a growing percentage of European customers are doing so. 


source: ETNO

How Long is the FTTH Payback Cycle?

As fixed network revenue sources increasingly rely on internet access as the foundation service, with declining take rates for voice or entertainment video services owned by the telcos, the payback model for fiber-to-home upgrades gets more challenging, above and beyond price declines.  


Without adjusting for currency differences and costs of living, internet access costs between $60 and $70 a month, some studies find. 

source: Analysys Mason 


Think about the payback implications. In the U.S. market, for example, the cost of passing a home location using FTTH might be in the $600 range. The additional cost to connect a customer might be in the $700 range. 


At 50-percent take rates (high, by telco standards), that means half the assets are stranded. The network infrastructure cost for one paying customer is $1200 plus $700, or about $1900. The reason is that the payback for one customer means passing two locations. 


Annual revenue for one FTTH home broadband location, at perhaps $600, means a rather-lengthy payback, as amortized overhead, debt service and principal repayment, inflation, operating costs and marketing and retention costs must also be included. 


Even assuming a 20-percent profit margin, that still means 80 percent of revenue is consumed by operating costs, marketing, amortization of debt and other overhead, including personnel costs, retirement fund payments, dividend payments, taxes and so forth. 


So, roughly speaking, assume that 80 percent of $600 in annual revenue is needed to cover mostly-fixed costs. That leaves about $120 annually in free cash flow. That implies a long payback cycle.


DIY and Licensed GenAI Patterns Will Continue

As always with software, firms are going to opt for a mix of "do it yourself" owned technology and licensed third party offerings....