Showing posts sorted by relevance for query S curve. Sort by date Show all posts

Thursday, July 16, 2020

S Curve, Bass Model, Gompertz Function

The concept of the S curve has proven to be among the most-significant analytical concepts I have encountered over the years. It describes product life cycles, suggests how business strategy changes depending on where on any single S curve a product happens to be, and has implications for innovation and start-up strategy as well. 


source: Semantic Scholar 


Some say S curves explain overall market development, customer adoption, product usage by individual customers, sales productivity, developer productivity and sometimes investor interest. It often is used to describe adoption rates of new services and technologies, including the notion of non-linear change rates and inflection points in the adoption of consumer products and technologies.


In mathematics, the S curve is a sigmoid function. It is the basis for the Gompertz function which can be used to predict new technology adoption and is related to the Bass Model.


 I’ve seen Gompertz used to describe the adoption of internet access, fiber to the home or mobile phone usage. It is often used in economic modeling and management consulting as well.

Tuesday, November 30, 2021

Before Metaverse There was Second Life

Before the metaverse there was Second Life. It has been a decade and a half since Second Life was heralded as the next big thing: virtual worlds. Second Life still is around, but did not really become the next big thing. In fact, significant new technologies often take decades to become commercially relevant or ubiquitous.


Advanced technology often does not get adopted as rapidly as the hype would have you believe. In fact, most useful advanced technologies tend not to go mainstream until adoption reaches about 10 percent. That is where the inflection point tends to occur. That essentially represents adoption by innovators and early adopters.


source: LikeFolio


Consider mobile phone use, among the most-ubiquitous products used globally. On a global basis, it took more than 20 years for usage to reach close to 10 percent of people. The point is that even a truly useful or transformative new product or technology can take a decade or more to reach the early adopter stage, which is when 10 percent of people or households use an innovation. 


source: Quora


That is why Sigmoid curves are the rule for product or technology diffusion. The S curve has proven to be among the most-significant analytical concepts I have encountered over the years. 


It describes product life cycles, suggests how business strategy changes depending on where on any single S curve a product happens to be, and has implications for innovation and start-up strategy as well. 


source: Semantic Scholar 


Some say S curves explain overall market development, customer adoption, product usage by individual customers, sales productivity, developer productivity and sometimes investor interest. It often is used to describe adoption rates of new services and technologies, including the notion of non-linear change rates and inflection points in the adoption of consumer products and technologies.


In mathematics, the S curve is a sigmoid function. It is the basis for the Gompertz function which can be used to predict new technology adoption and is related to the Bass Model.


 I’ve seen Gompertz used to describe the adoption of internet access, fiber to the home or mobile phone usage. It is often used in economic modeling and management consulting as well.


The next big thing will have first been talked about roughly 30 years ago, says technologist Greg Satell. IBM coined the term machine learning in 1959, for example.


The S curve describes the way new technologies are adopted. It is related to the product life cycle. Many times, reaping the full benefits of a major new technology can take 20 to 30 years. Alexander Fleming discovered penicillin in 1928, it didn’t arrive on the market until 1945, nearly 20 years later.


Electricity did not have a measurable impact on the economy until the early 1920s, 40 years after Edison’s plant, it can be argued.


It wasn’t until the late 1990’s, or about 30 years after 1968, that computers had a measurable effect on the US economy, many would note.


source: Wikipedia


The point is that the next big thing will turn out to be an idea first broached decades ago, even if it has not been possible to commercialize that idea. 


Metaverse seems to follow the pattern.


Monday, April 6, 2020

The Power of the S Curve for Every Business

This graph illustrates the normal S curve curve of consumer or business adoption of virtually any successful product, as well as the need to create the next generation of product before the legacy product reaches its peak and then begins its decline. 


The curves show that 4G is created and then is commercialized before 3G reaches its peak, and then declines, as the new product displaces demand for the old.  The data, from the Global Mobile Suppliers Association, shows that by the end of 2014, 3G reached its peak. 

source: GSA


The 4G network reaches an inflection point at about the same time. If one examines each curve separately, successive S curves are the pattern. A firm or an industry has to begin work on the next generation of products while existing products are still near peak levels. 


source: Strategic Thinker


It also can take decades before a successful innovation actually reaches commercialization. The next big thing will have first been talked about roughly 30 years ago, says technologist Greg Satell. IBM coined the term machine learning in 1959, for example.


The S curve describes the way new technologies are adopted. It is related to the product life cycle. Many times, reaping the full benefits of a major new technology can take 20 to 30 years. Alexander Fleming discovered penicillin in 1928, it didn’t arrive on the market until 1945, nearly 20 years later.


Electricity did not have a measurable impact on the economy until the early 1920s, 40 years after Edison’s plant, it can be argued.


It wasn’t until the late 1990’s, or about 30 years after 1968, that computers had a measurable effect on the US economy, many would note.


source: Wikipedia


The point is that the next big thing will turn out to be an idea first broached decades ago, even if it has not been possible to commercialize that idea. 


The even-bigger idea is that all firms and industries must work to create the next generation of products before the existing products reach saturation. That is why work already has begun on 6G, even as 5G is just being commercialized. Generally, the next-generation mobile network is introduced every decade. 


Saturday, April 2, 2016

Is "Artificial Intelligence" S Curve Going to Affect Telecom?

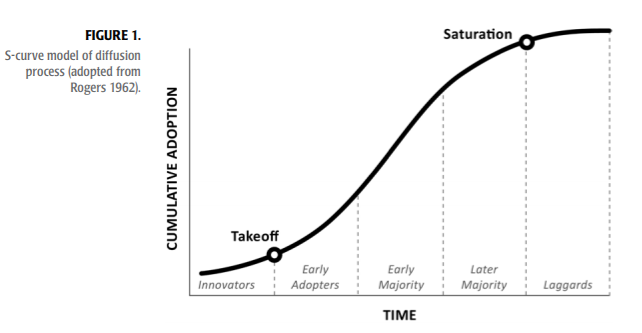
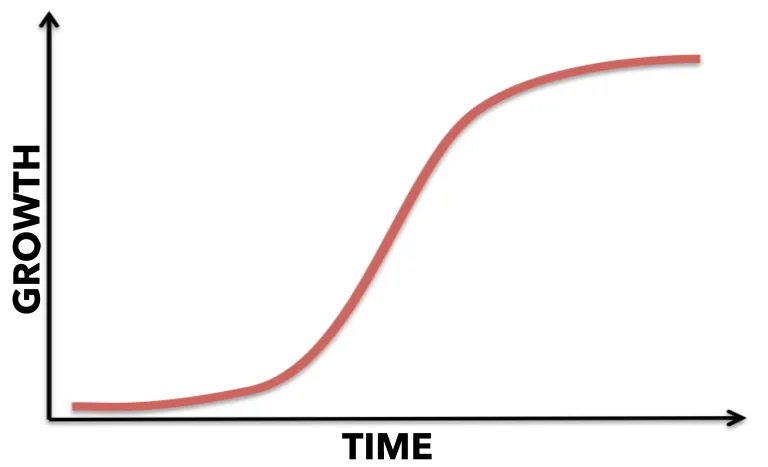
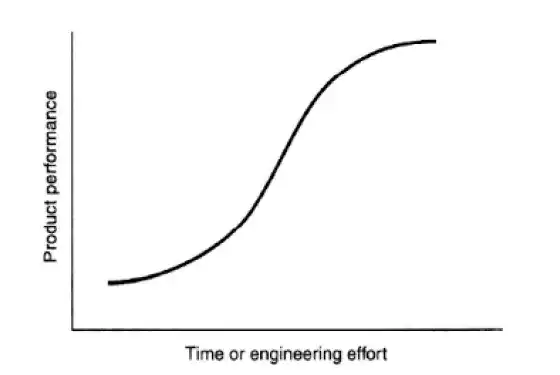
One recurring pattern in modern technology and for most products, including communications technology, is its nonlinear character. Many call that an “S curve.” The principle also is highly similar to the product life cycle.

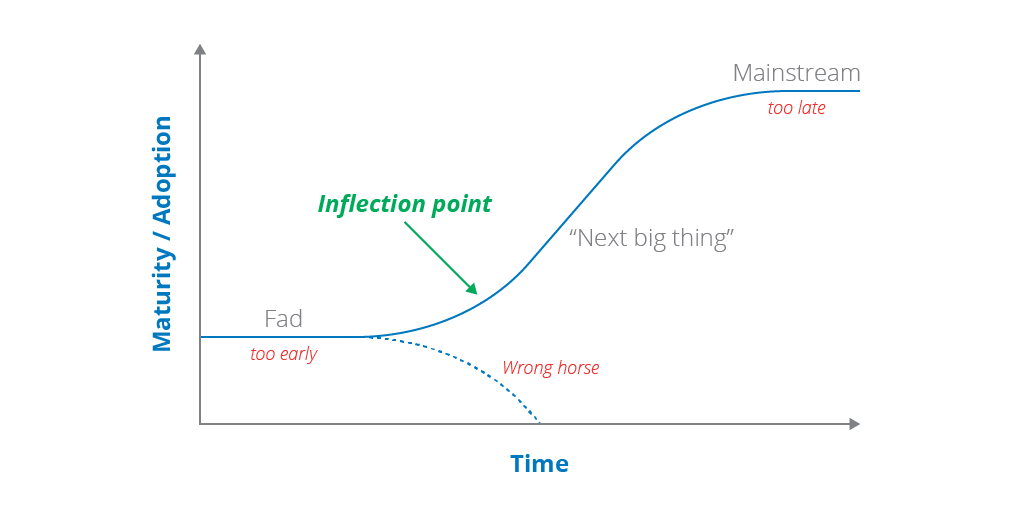
Experientially, the S curve is important because it plays a part in human expectations about disruptive new technology. We often expect more change early on, do not see it, and conclude that the trend will not happen. Instead, there is a gestation period, and then an inflection point.

After that, the new trend takes hold rapidly, producing far more change than one might have expected if the process of technology adoption were linear.

That might be worth keeping in mind over the next decade as we make more advances in machine learning, often popularly known as "artificial intelligence." In fact, one might argue that machine intelligence is part of the earlier hype about "big data analytics." The whole point of machine learning is that programs can autonomously "learn" to behave differently, based on new data.

Driverless cars perhaps provide one obvious example of applied big data analytics and machine learning.

Artificial intelligence might be increasingly important for some parts of the telecom business in the future as well.

Much "value" in the sales process traditionally comes from "expert advice" supplied by sales personnel. What happens if much of the expert advice can be supplied by machines, delivering advice over Internet mechanisms?

How might enterprise sales processes change if expert advice can be obtained from smart software, circumventling human channels?

We have seen glimmers of this in other industries, especially industries whose products are amenable to digital substitutiion. 

“Time and again, we have seen digital disruption fundamentally erode value across many industries including: music sales, video rentals, travel booking, and newspapers,” says the Citi Digital Strategy Team.

“In each of these cases, incumbents either transformed or became marginalized,” a Citi report says.

“Digital disruption in these industries resulted on average in a 44 percent share-shift from physical to digital business models over a 10-year period,” according to Citi’s Digital Strategy team.

Market share shifts gradually (1.6 percent per year) until an inflection point around year four when traditional share declines rapidly accelerate to about six percent per year, Citi says.

To say the global telecom business is “different” now since a wave of worldwide deregulation, privatization, investment and emergence of the Internet is a vast understatement. But consider just a few of the biggest changes.

Pre-1980, most national telecom infrastructures were dominated by a single monopoly provider, often owned by the government. In fact, telecommunications was widely believed to be a natural monopoly.

So prices were high, profit margins were high, innovation was low, revenue growth very limited, and the size of the market quite stable.

After deregulation and privatization, prices dropped dramatically, investment increased, total revenue increased, profit margins dropped and rates of innovation climbed dramatically.

In 1991, state-owned telcos numbered about 150. By 2008, that number had dropped to about 70, according to the International Telecommunications Union. By 2008, some 125 nations had fully or partially privatized former state-owned telecom companies, lead especially by mobile operations.

At the same time, the emergence of the Internet and mobility reshaped platforms, the way applications are developed, the power and influence wielded within the ecosystem, business models and value drivers.

At the same time, communications capabilities were rapidly extended to those who previously had no access, rather suddenly transforming a market where perhaps half the world’s people could not “make a phone call” to a world where most adults now have such access, after just a few decades.

And while a similar change, allowing everyone Internet access, is only now underway, it is reasonable to expect that challenge also will be solved, more rapidly than anyone originally might have believed possible.

Three Decades of Disruption
1980
2015
Natural monopoly
Oligopoly
High margin
Moderate to low margin
Low to moderate adoption
High adoption
Low innovation
High innovation
Stable markets
Unstable markets
Compete on quality
Compete on price
Fixed network dominates
Mobile network dominates
Tightly integrated apps and network
Open network
Owned app creation
3rd-party app creation
Sell app, use network access
Sell network access (dumb pipe)
Voice business model
Internet access, mobile business model
Similar business models globally
Growing diversity of business models
99.999% uptime
99.9% or “good enough” availability
Few lead apps
Many lead apps
IT adoption: enterprise; SMB; consumer
IT adoption: consumer/SMB to enterprise

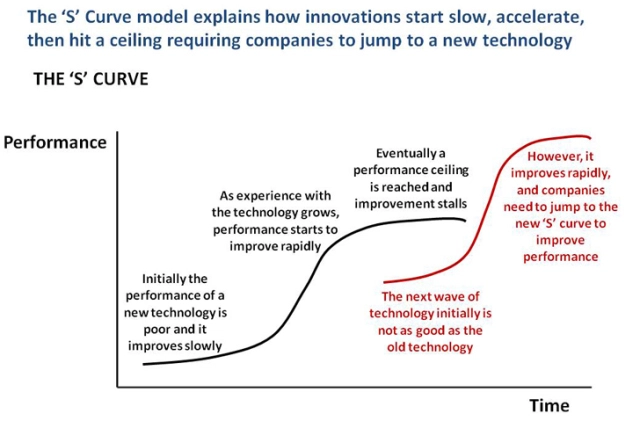
The basic idea is that innovations tend to start slow, but hit an inflection point, then grow rapidly, until hitting a mature and then a declining phase.

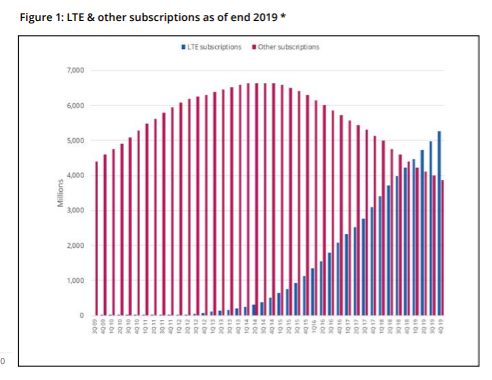
Most business and technology developments in the telecommunications business, especially those related to applications and products related to the Internet, seem to follow the S curve.


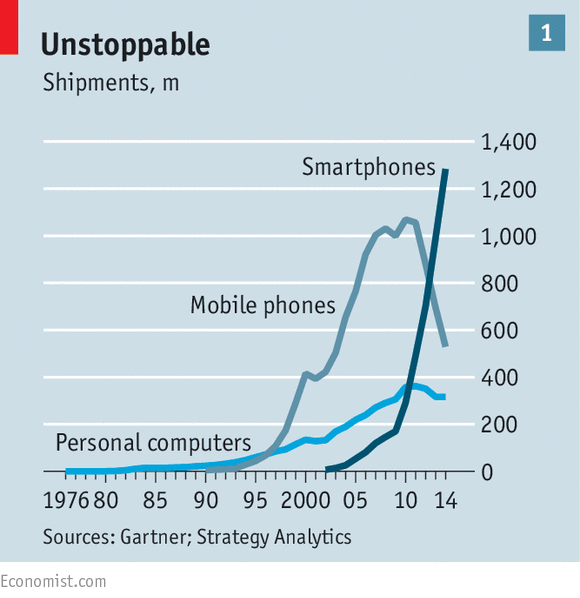
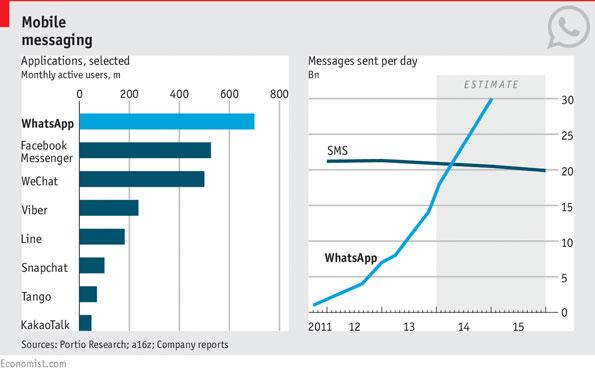
Adoption now tends to occur very fast. Mobile phones and smartphones provide excellent examples, compared to “earlier” technology such as personal computers.

Adoption of social apps such as WhatsApp show the same pattern.


The point is that most trends have less impact initially than you might expect, but then hit an inflection point and have much more impact than you might expect, were change a linear function.

The implication is that many important changes will seem to go for some period of time where the impact is not seen, but then can gain acceptance very quickly.

“Technology does not just change distribution models and service patterns,” a report by Citi says.  
“The definition of financial products themselves may need to be rethought.”

”We’ll probably be the last generation to use the term credit card and debit card,” said John Stumpf, Wells Fargo CEO. “It will probably be debit access and credit access and it will be likely loaded onto a mobile device.”

Saturday, June 5, 2021

U.S. Gigabit Home Broadband Nears Inflection Point

About 9.6 percent of U.S. home broadband accounts now buy service at 1 Gbps, says Openvault. That is important because, historically, successful consumer products hit an adoption inflection point at about 10 percent adoption rates. In the colloquial, what happens is that “you buy because your neighbor has it.”


source: Openvault 


To the extent that gigabit internet access can be considered a discrete product, a shift in buying to gigabit speeds by a growing percentage of customers also will shift the rest of the market toward higher speeds. 


The inflection point around 10 percent adoption fits with the classic “S curve” of business or product evolution as well. 


source 


It is worth noting that not every innovation succeeds. Perhaps most innovations and products aimed at consumers fail, in which case there is no S curve, only a decline curve. 


source: Thoughtworks 


The consumer product adoption curve and the S curve also are related to the point at which early adopters are buyers, but before the mass market adoption starts. 


source: Advisor Perspectives

Monday, August 20, 2018

S Curves Only Apply to Successful Innovations

Some generally-useful visualizations, such as the S curve, require some qualification. You may think of the S curve as showing the technology life cycle, a product life cycle or an innovation life cycle. The basic idea is that adoption starts slow, hits an inflection point featuring fast growth, but eventually reaches saturation as nearly every potential user or buyer already has become a user or customer.


The major qualification is that the S curve applies to innovations, products or processes that succeed in the market. Unsuccessful innovations simply die. Perhaps they go parabolic before they die. The point is that S curves refer only to products, technology and services that actually succeed in the marketplace.

It probably is worth noting that something similar exists for hyped technologies as tracked by the Gartner Group. Between 2017 and 2018, some nine technologies simply disappeared. That is perhaps a good illustration of unfulfilled hype.


Gartner Hype Cycle 2017
Gartner Hype Cycle 2018


AI Wiill Indeed Wreck Havoc in Some Industries

Creative workers are right to worry about the impact of artificial intelligence on jobs within the industry, just as creative workers were r...