According to US Telecom, U.S. home broadband prices continue to fall, when looking at the most popular service plans consumers actually buy. The BPI-Consumer Choice compares providers’ most popular speed tier of broadband service in a given year to its most comparable 2022 service.
The BPI-Speed compares providers’ fastest speed tier option in a given year to the comparable plan in 2022.

source: US Telecom
Using what is called the “Real Broadband Price IndexI-Consumer Choice method (looking at prices for the service plans most people actually buy),broadband prices dropped by 14.7 percent from 2021 to 2022, UST says.
Over a longer time span, Real BPI-Consumer Choice tier prices dropped by 44.6 percent from 2015 to 2022, UST adds, while Real BPI-Speed tier prices dropped by 52.7 percent from 2015 to 2022.

source: US Telecom
Real BPI-Speed broadband prices dropped by 11.6 percent from 2021 to 2022, the group says. In contrast, the cost of overall goods and services rose by eight percent from 2021 to 2022, UST says.
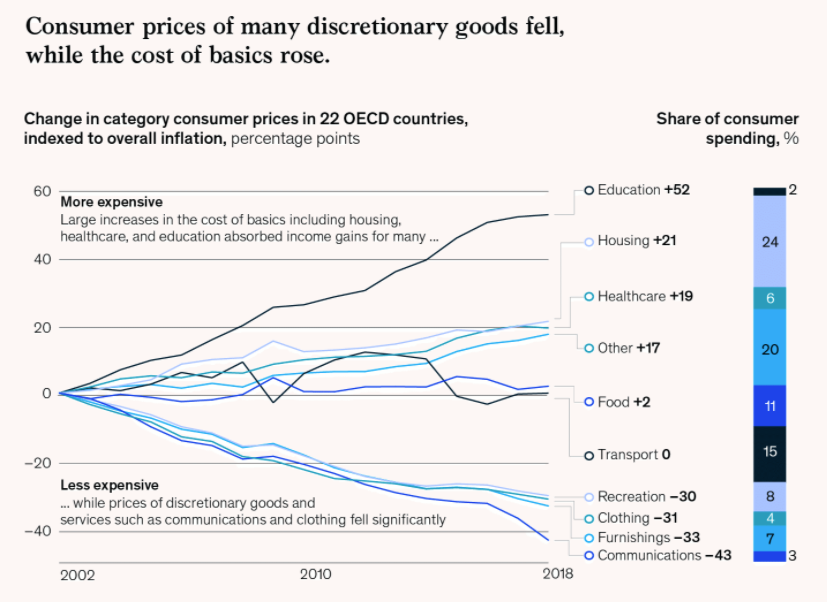
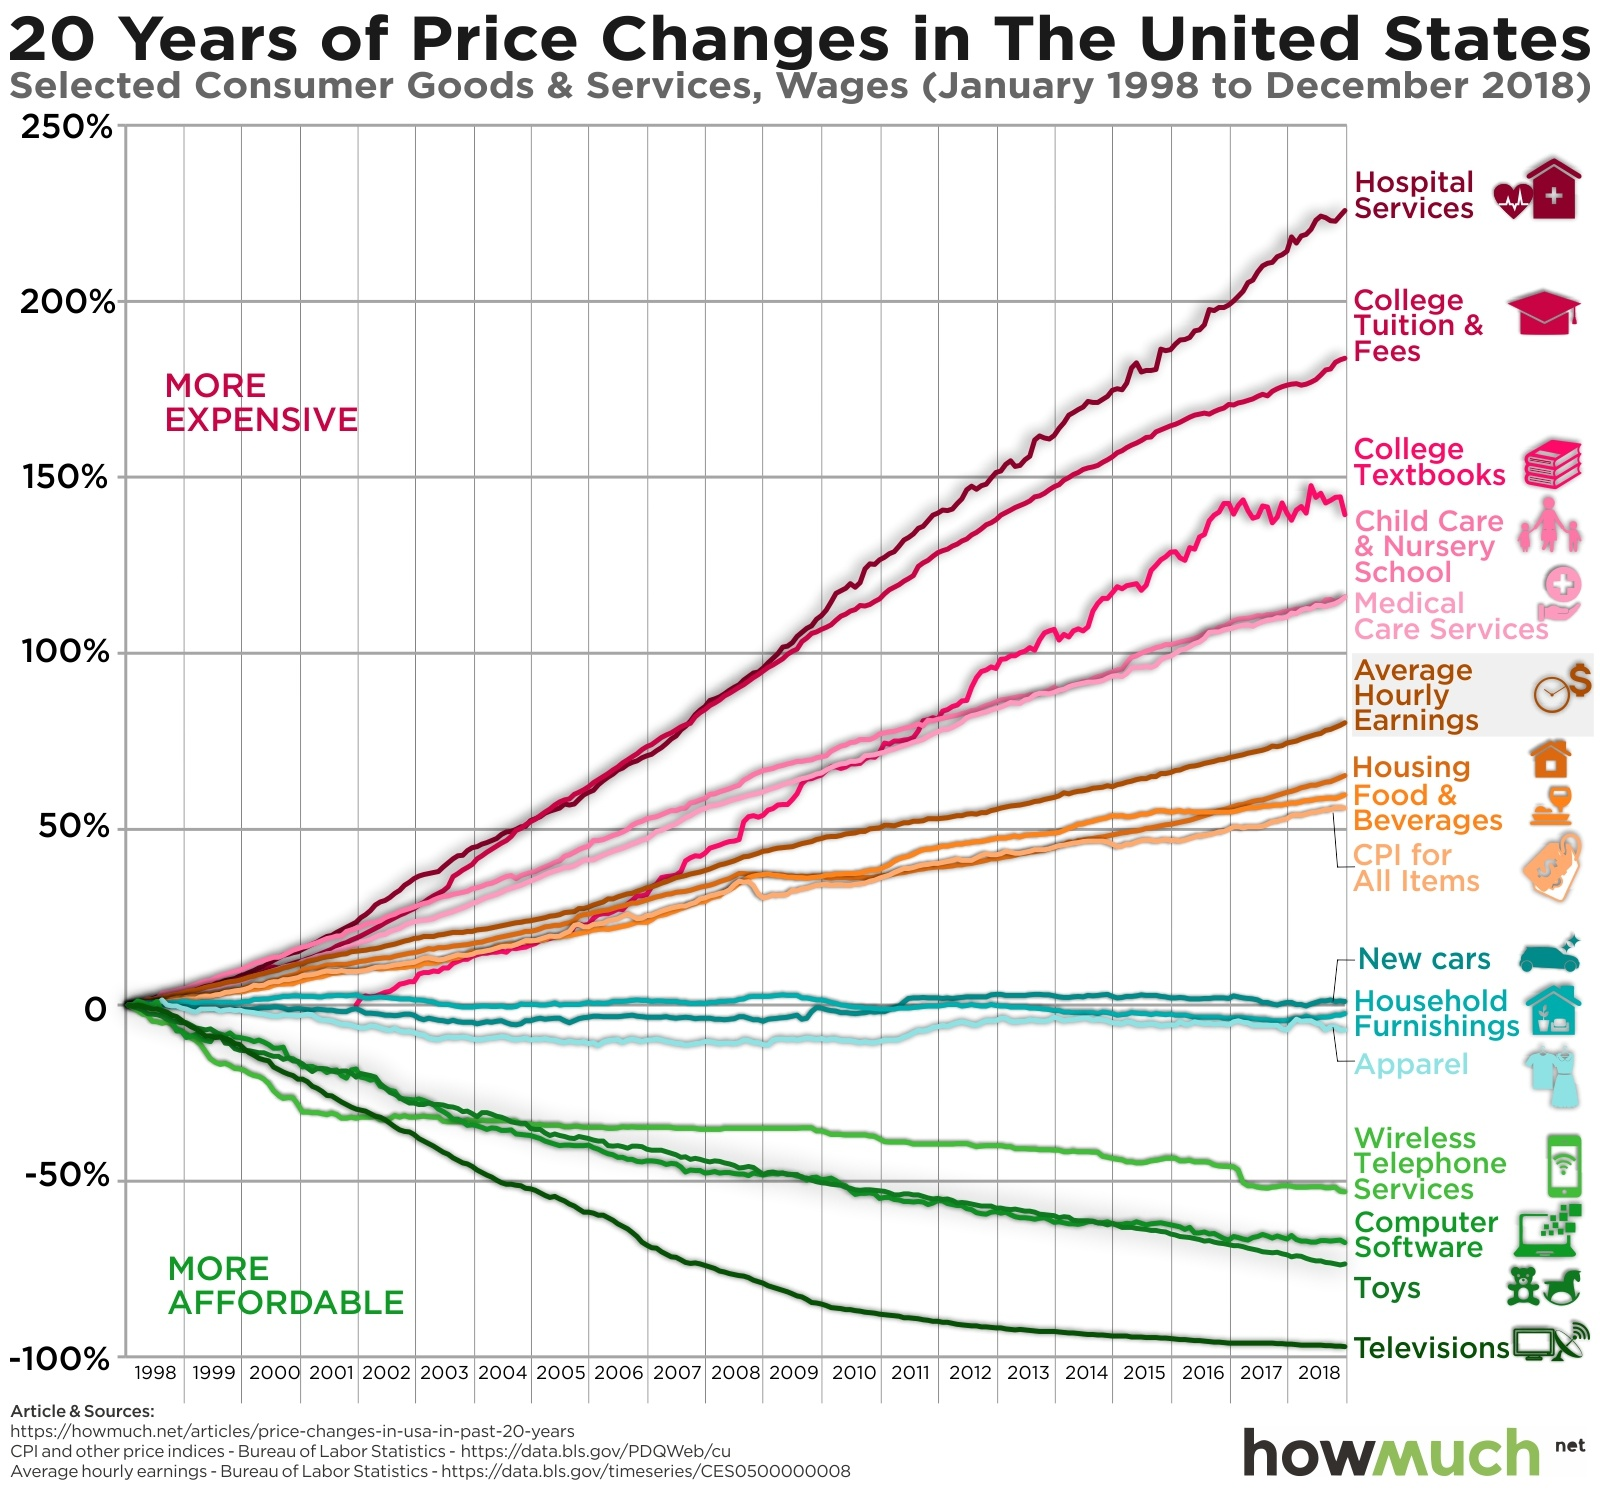
Other analyses support similar conclusions. Because of inflation, price levels rise over time. So virtually any product can be accused of “costing more” in 2022 than it cost in 1996.
Some may intuitively feel this cannot be the full story where it comes to digital products, which keep getting better, while prices either stay the same or decline. Such hedonic change applies to home broadband.
Hedonic qualIty adjustment is a method used by economists to adjust prices whenever the characteristics of the products included in the consumer price index change because of innovation. Hedonic quality adjustment also is used when older products are improved and become new products.
That often has been the case for computing products, televisions, consumer electronics and--dare we note--broadband internet access services.
Hedonically adjusted price indices for broadband internet access in the U.S. market then looks like this:
source: Bureau of Labor Statistics
Quality improvements also are seen globally.
Adjusting for currency and living cost differentials, however, broadband access prices globally are remarkably uniform.
The 2019 average price of a broadband internet access connection--globally--was $72..92, down $0.12 from 2017 levels, according to comparison site Cable. Other comparisons say the average global price for a fixed connection is $67 a month.
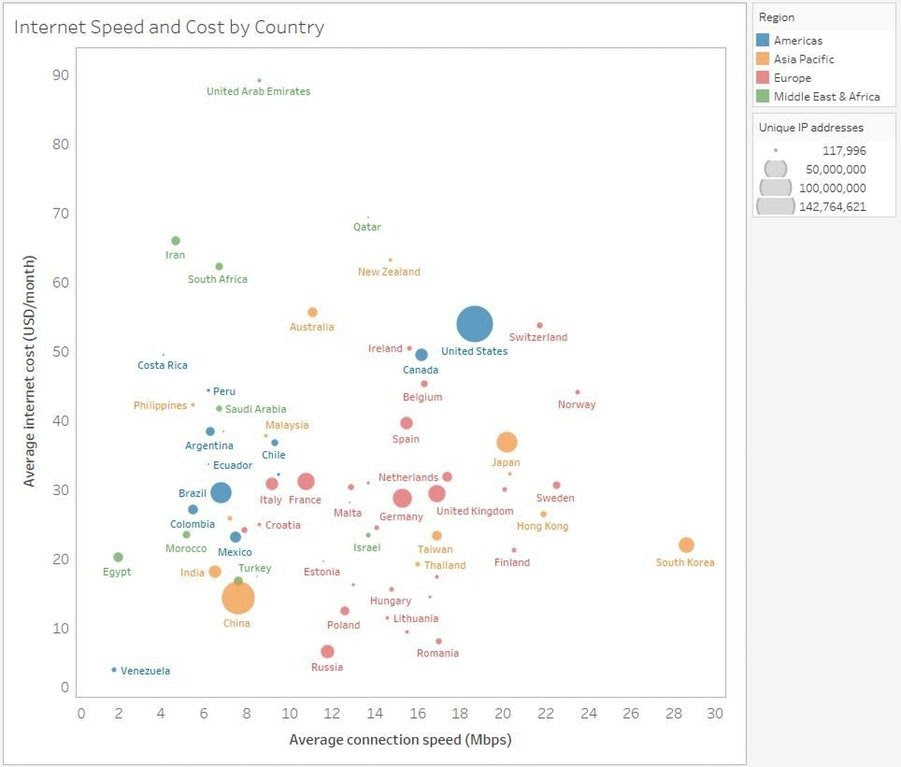
Looking at 95 countries globally with internet access speeds of at least 60 Mbps, U.S. prices were $62.74 a month, with the highest price being $100.42 in the United Arab Emirates and the lowest price being $4.88 in the Ukraine.
According to comparethemarket.com, the United States is not the most affordable of 50 countries analyzed. On the other hand, the United States ranks fifth among 50 for downstream speeds.
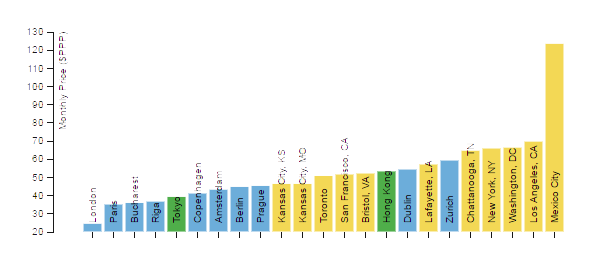
Another study by Deutsche Bank, looking at cities in a number of countries, with a modest 8 Mbps rate, found prices ranging between $50 to $52 a month. That still places prices for major U.S. cities such as New York, San Francisco and Boston at the top of the price range for cities studied, but do not seem to be adjusted for purchasing power parity, which attempts to adjust prices based on how much a particular unit of currency buys in each country.
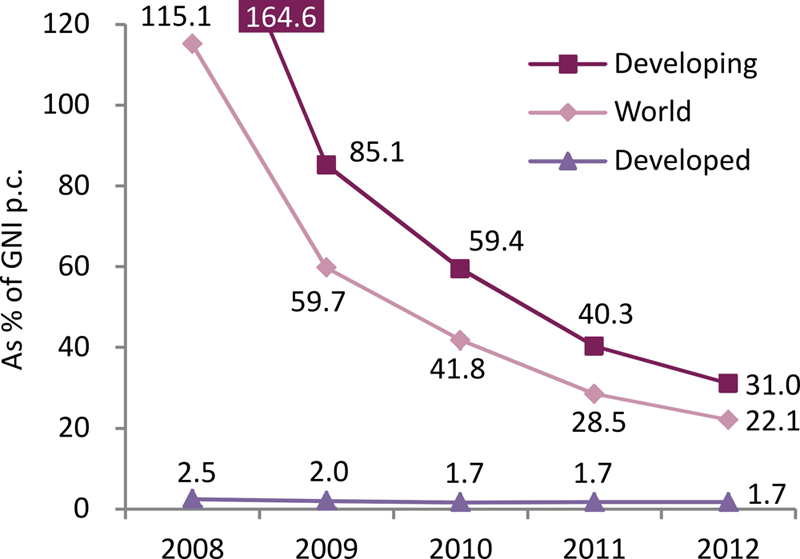
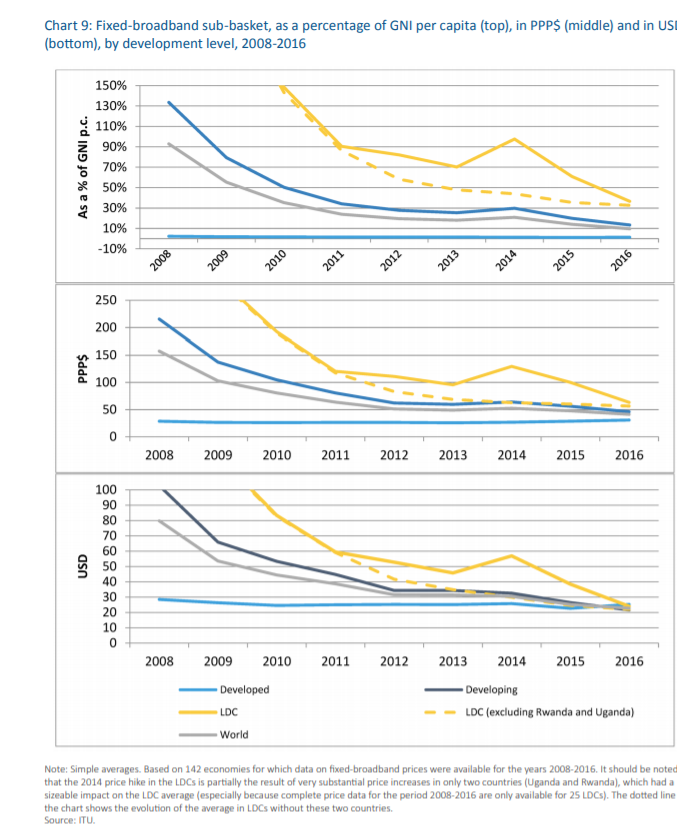
The other normalization technique used by the International Telecommunications Union is to attempt to normalize by comparing prices to gross national income per person. There are methodological issues when doing so, one can argue. Gross national income is not household income, and per-capita measures might not always be the best way to compare prices, income or other metrics. But at a high level, measuring prices as a percentage of income provides some relative measure of affordability.
Looking at internet access prices using the PPP method, developed nation prices are around $35 to $40 a month. In absolute terms, developed nation prices are less than $30 a month.
According to an analysis by NetCredit, which shows U.S. consumers spending about 0.16 percent of income on internet access, “making it the most affordable broadband in North America,” says NetCredit.
Looking at internet access prices using the purchasing power parity method, developed nation prices are around $35 to $40 a month. In absolute terms, developed nation prices are less than $30 a month.
Methodology always matters. The average U.S. home broadband service costs about $64 a month. In fact, U.S. home broadband inflation-adjusted costs have declined since the mid-1990s, according to an analysis of U.S. Consumer Price Index data.
That will often not be obvious when observers consider only “current” prices for home broadband, and compare them to past “retail” prices.
Despite the oft-repeated claims that U.S. home broadband is “too expensive,” careful analysis suggests the answer is far from clear. In fact, using measures to normalize prices for different costs across countries; accounting for inflation; taking into account the actual plans people actually buy; including cost per gigabit per second of speed and also accounting for hedonic product change, the opposite conclusion might be reached.