Thursday, August 16, 2018

S&P Communications Index Reflects Cross-Industry Convergence

On September 28, S&P Dow Jones Indices and GICS will create a new sector for tech, media, and telecoms companies. "The lines among media, communications, and content are blurred," David Blitzer, chairman of the index committee at S&P Dow Jones Indices, said. "It is time to acknowledge this convergence and the overlapping services these companies provide."

It will only have 60 components, making it the eighth-largest by this metric. However, those components will include some of the biggest stocks on the market. Walt Disney Co., Netflix, Facebook, Alphabet, Comcast Corp., AT&T, Verizon, CenturyLink and others, such as 21st Century Fox, TripAdvisor and Electronic Arts.


“The last several years have seen an evolution in the mode in which people communicate and access entertainment content and other information,” S&P Global says. “This evolution is a result of the integration between telecommunications, media, and internet companies.”
source: Morgan Stanley

Platforms Really Do Matter

Soon enough, we will be trying to make predictions about the impact of 5G on fixed network internet access lines, on end user typical speeds, typical retail prices, video entertainment accounts and service provider market shares. It is going to keep us busy, as few trends will be stable.

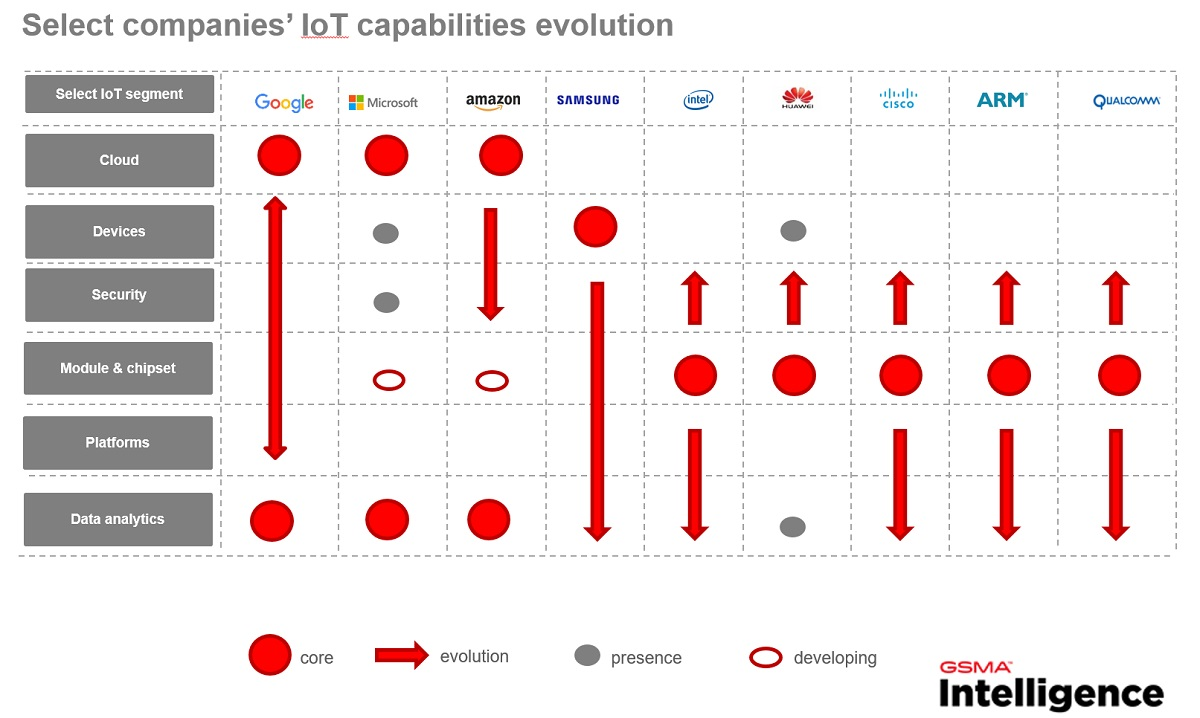
And platforms really do matter.

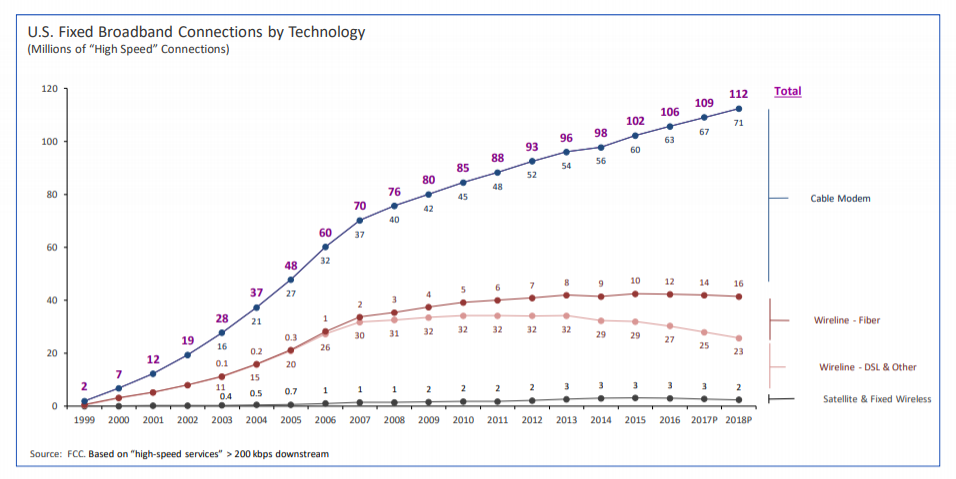
It is hard to overemphasize the importance the cable industry has had in driving U.S. internet access services. Cable has been the market share leader since about 2000. Telco fiber to home connections have grown, but growth has been relatively slow. Digital subscriber line has declined, with satellite connections reaching a peak of about three million before seemingly settling back to about two million accounts.

Many of us believe 5G will be a bigger platform innovation that cable's hybrid fiber coax network was.

One basic rule I use when evaluating service provider business models is to assume that tier-one service providers lose about half their current revenue about every 10 years, and therefore have to replace more than that amount of revenue to sustain growth. The rule likely works even for small independent service providers (I haven’t tried to quantify that historically, mostly because I do not have access to enough data).


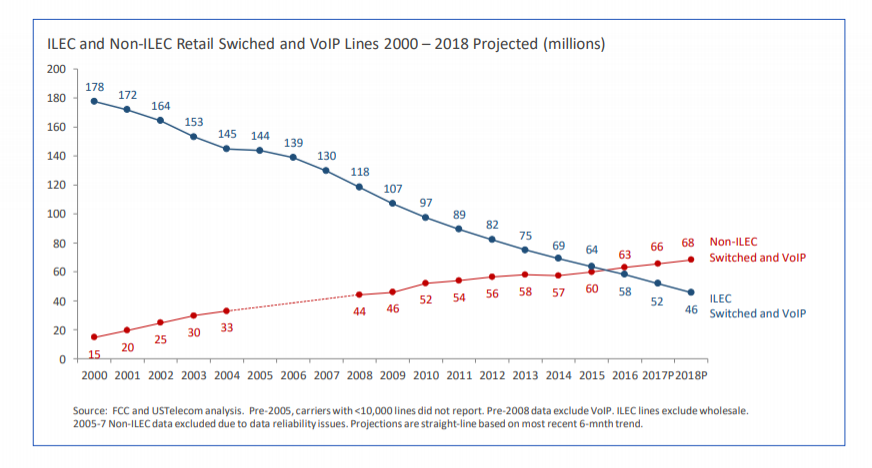
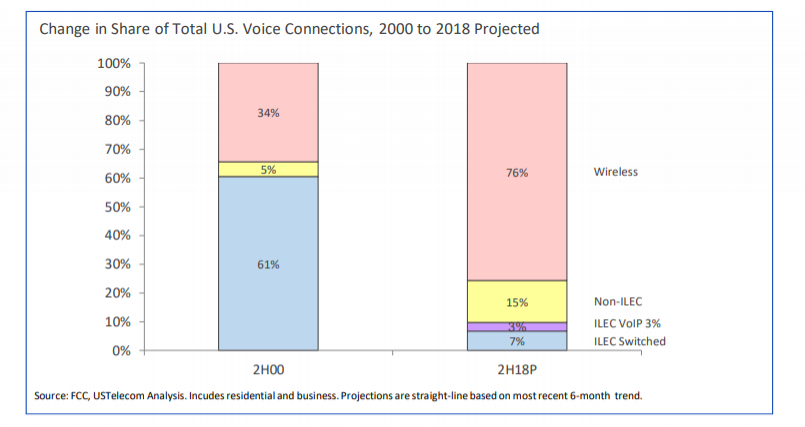
It is easy enough to quantify what happened in the U.S. voice market. By 2000, mobile already represented about 34 percent of all voice lines, though arguably these were additional to the installed base of fixed network lines.

By 2018, fixed network providers have perhaps 25 percent of total lines, while mobility represents 75 percent of accounts. And in 2018, it is clear that mobile has become a substitute for fixed line voice service.


We saw this trend in long distance services, various enterprise data services, fixed network voice, now mobile voice and messaging, entertainment video and even glimmers in the internet access area.

As 5G is commercialized, we almost certainly will see mobile substitution for fixed network internet access, though it is hard to quantify the amount of change. But voice substitution provides possible guidance.

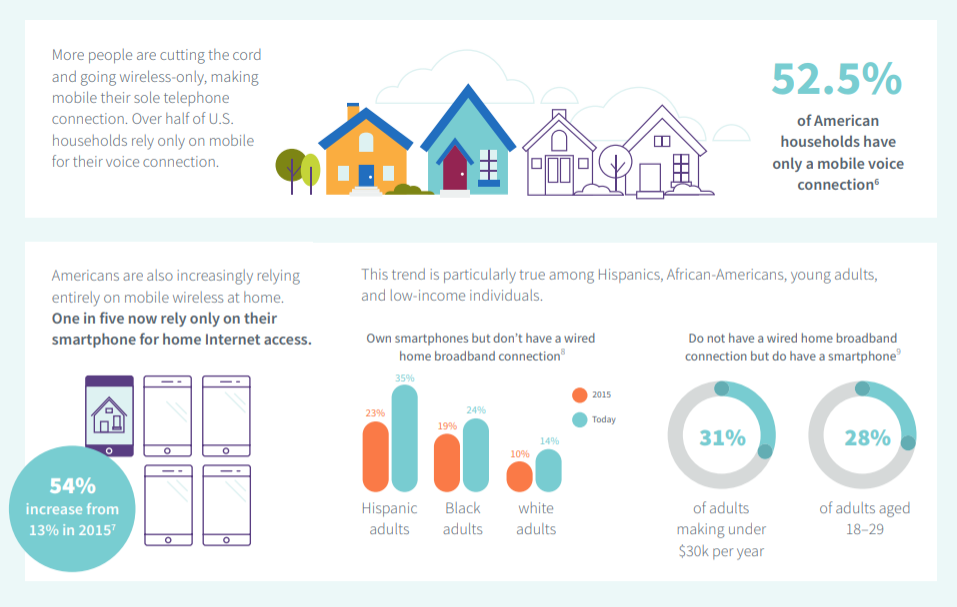
In the U.S. market, a substantial portion of U.S. consumers now rely exclusively on mobile internet access. In fact, such mobile substitution already represent as much as 20 percent of U.S. households, says the CTIA. In some segments, such substitution might be higher, as much as 35 percent.


So one might ask the question of how much further that trend can go, as 5G is commercialized, and major service providers begin to actively market 5G-based services that compete directly with fixed network internet access services.

We already know what happened with voice. The portion of U.S. households that rely on mobile-only  telephone service grew from three percent in 2003 to 53 percent in 2016, US Telecom says, using Federal Communications Commission data.

So it would not be far fetched to suggest that at least half of all existing fixed network internet access connections could eventually be replaced by wireless or mobile alternatives.

U.S. Service Provider Capex Returns to 2014 Levels

A two-year decline in private capital investment in U.S. broadband infrastructure from 2014 to 2016 appears to be over, according to a preliminary USTelecom analysis of the 2017 capital expenditures of wireline, wireless, and cable broadband service providers.

U.S. broadband companies, excluding independent competitive local providers and fiber operators, have invested between $72 and $74 billion in network infrastructure in 2017, compared to $70.6 billion in 2016, showing at least an increase of nearly $1.5 billion, UST says.


Wednesday, August 15, 2018

IoT Success Might Typically Require Moving Up, Down the Stack, or Both

How big is IoT? Big. According to GSMA analysts, some 7.6 billion IoT connections (mobile and non-mobile) were in service in 2017.

The complication, for communications service providers, is that the vast majority of those IoT devices are connected by unlicensed radio technologies, designed for short-range connectivity (Wi-Fi, Z-Wave and Zigbee). That might be quite as true for some future IoT apps (autonomous vehicles, for example). Still, the point is that most future IoT connections might generate zero incremental revenue growth for connectivity providers.

And for many connections that are net additions, annual revenue might be quite low.

Mobile network IoT connections might grow from 600 million connections in 2017 to 3.1 billion in 2025. That might represent 12 percent of mobile accounts. And 60 percent of those might require mobility, while 40 percent are fixed, GSMA argues, using either NB-IoT or  LTE-M.

Of total IoT ecosystem revenues, 66 percent might come from platforms, applications and services. Professional services will grab another 27 percent. That leaves about five percent for connectivity services, declining from 10 percent today.

That is the reason many argue connectivity providers will have to move up or down the stack to capture more of the IoT revenue growth. That is the same strategy chip, device, app and platform providers will be employing, as well.

The bottom line is that IoT might require most would-be major players to move up, down, or up and down the stack.


source: GSMA

Verizon Fixed 5G Strategy: Attack Out of Region

Verizon’s strategy for its 5G fixed wireless platform is fairly clear, so far. In its announced first four cities--Indianapolis, Houston, Los Angeles and Sacramento--Verizon is attacking out of its fixed network footprint, and therefore will be competing head to head with AT&T, Comcast and Charter Communications.

One obvious objective is to grow revenue and accounts the “old fashioned way,” by taking market share away from incumbents who already have those accounts, in the fixed network internet access business.

Comcast passes (can actually sell service) about 54 million homes. Charter Communications passes some 50 million home locations.

AT&T’s fixed network passes perhaps 62 million U.S. homes. Verizon, on the other hand, passes perhaps 27 million locations.

What that means is that Verizon has a clear interest in using 5G fixed wireless to expand its addressable market by more than 35 million U.S. homes (up to perhaps 39 million) that it cannot reach today, giving Verizon a fixed network footprint that is comparable to its key rivals.

Tuesday, August 14, 2018

Does Better Internet Access Cause Rural Economic Growth?

A new examination of the correlation between internet access and unemployment, income and employment in rural U.S. areas finds no correlation. That matters because any government program to expand internet access availability is based on the fundamental assumption that internet access “leads to” or “causes” economic growth.


On the other hand, there is a subtlety: there might be a correlation (not causation, though) between use of internet access and economic growth.


So one researcher argues the focus should be on spurring adoption by people who do not use the internet, rather than a focus on increasing internet access availability in  “underserved areas” as such.


That actually is a rather non-controversial observation, as many observers have noted that teaching people how to use the internet, and why it is useful,  is among the keys to spurring use of the internet by the the last 15 percent to 20 percent of non-users.


What we need is “a nuanced approach to broadband policy that is targeted to those individuals who have not adopted broadband Internet,” according to Will Rinehart, American Action Forum director of technology and innovation policy.


For people to benefit from the Internet, they need to use it, not merely have access to it. Yet, the trend in policy is toward expanding broadband networks, not promoting their adoption. The best mix of policies will certainly vary depending on local needs, but the key to helping local economies is getting more people connected to the Internet, not merely increasing availability.


“Broadband access is not correlated with economic growth, although broadband adoption is,” he says.  


The “percentage of the population with access to 25 Mbps down/3 Mbps up broadband “doesn’t explain the unemployment rate, median household income, the change in employment, or the rate of population change in rural regions,” says Will Rinehart, American Action Forum director of technology and innovation policy.


An analysis using the 4 Mbps down/1 Mbps up standard also shows no connection, he says.  “This analysis calls into question whether the 25 Mbps download and 3 Mbps upload metric, the older 4 Mbps download and 1 Mbps upload metric, or any availability standard for that matter, provides a reasonable understanding of the underlying economics of rural communities,” says Rinehart.

Cable Gets 100% of Net Internet Access Accounts in 2Q 2018

The largest cable and telephone providers in the U.S., representing about 95 percent of the market, acquired about 455,000 net internet access subscribers in the second quarter of  2018, compared to a gain of about 235,000 subscribers in the second quarter of 2017, according to Leichtman Research Group.

These suppliers providers now account for 97.1 million subscribers. Cable companies have 62.9 million subscribers, while telephone companies have  34.2 million accounts.

As has been the case in recent years, cable is getting virtually all the net additions. Telcos have had net account losses in each of the past nine quarters. A great percentage of the losses over that period have come at Frontier and CenturyLink. AT&T and Verizon sometimes gain, sometimes lose, but at a rather low rate, either way.

The top cable companies added about 585,000 subscribers in 2Q 2018, compared to about 465,000 net adds in 2Q 2017.

Telephone companies lost about 130,000 subscribers in 2Q 2018, compared to a net loss of about 230,000 subscribers in 2Q 2017.

Broadband Providers
Subscribers at end of 2Q 2018
Net Adds in 2Q 2018
Cable Companies


Comcast
26,509,000
260,000
Charter
24,622,000
267,000
Cox
5,020,000
20,000
Altice
4,082,100
9,500
Mediacom
1,251,000
23,000
WOW (WideOpenWest)
747,800
3,900
Cable ONE
653,876
2,326
Total Top Cable
62,885,776
585,726
Phone Companies


AT&T
15,772,000
(3,000)
Verizon
6,956,000
(10,000)
CenturyLink
5,506,000
(89,000)
Frontier
3,863,000
(32,000)
Windstream
1,006,700
2,300
Consolidated
786,787
1,557
Cincinnati Bell
310,500
(400)
Total Top Telco
34,200,987
(130,453)
Total Top Broadband
97,086,763
455,183

More Computation, Not Data Center Energy Consumption is the Real Issue

Many observers raise key concerns about power consumption of data centers in the era of artificial intelligence.  According to a study by t...