Tuesday, October 18, 2022

Comcast Boosts Home Broadband Speeds, Has Been Doing So at Moore's Law Rates for Two Decades

It should come as no surprise that Comcast is activating home broadband speed increases this week across its entire footprint. Comcast has increased home broadband speeds at Moore’s Law rates--doubling about every 18 months--for two decades.  


“Comcast has increased speeds 17 times in 17 years and has doubled the capacity of its broadband network every 18 to 24 months,” Comcast says. 


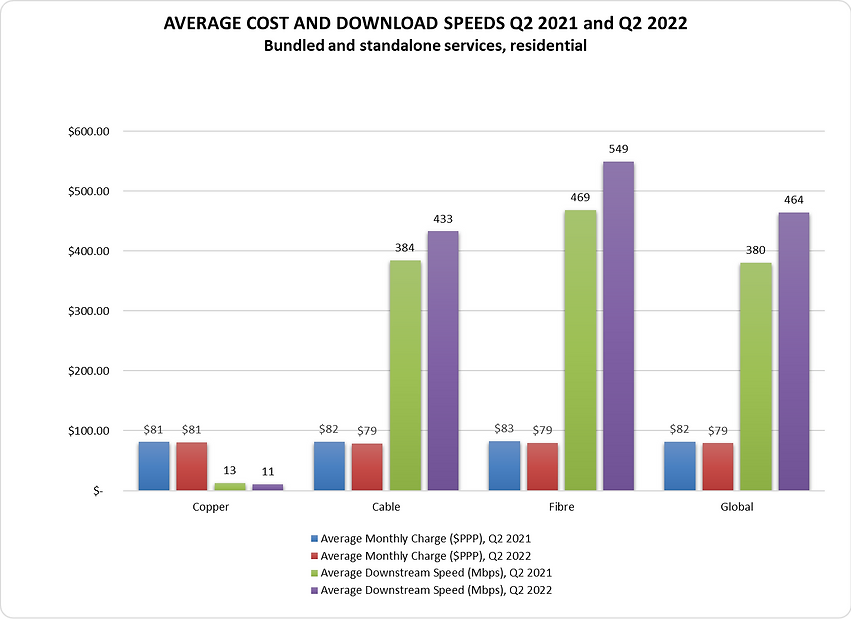
That is one reason why cable operators continue to hold between 65 percent and 70 percent share of the installed base of home broadband accounts in the United States. Telcos have simply not been able to increase bandwidth at Moore’s Law rates, though that should change as more of the network is converted to optical fiber access. 


The original insight for Microsoft was the answer to the question "What if computing were free?" Keep in mind the audacious assumption Gates made. In 1970 a computer cost about $4.6 million each. Recall that Micro-Soft (later changed to Microsoft) was founded in 1975

source: AEI 


The assumption that computing hardware was going to be “free” would have appeared insane to most observers. In 1982 Gates did not seem to go out of his way to argue that hardware would be free, but he did argue it would be cheaper and far less interesting than software. 


 Gates made the argument in 1994. Gates was still saying it in 2004.  


The point is that the assumption by Gates that computing operations would be so cheap was an astounding leap. But my guess is that Gates understood Moore’s Law in a way that the rest of us did not.


Reed Hastings, Netflix founder, apparently made a similar decision. For Bill Gates, the insight that free computing would be a reality meant he should build his business on software used by computers.


Reed Hastings came to the same conclusion as he looked at bandwidth trends in terms both of capacity and prices. At a time when dial-up modems were running at 56 kbps, Hastings extrapolated from Moore's Law to understand where bandwidth would be in the future, not where it was “right now.”


“We took out our spreadsheets and we figured we’d get 14 megabits per second to the home by 2012, which turns out is about what we will get,” says Reed Hastings, Netflix CEO. “If you drag it out to 2021, we will all have a gigabit to the home." So far, internet access speeds have increased at just about those rates.


Both supply and demand are part of the equation, however. Perhaps the driver of supply is Moore’s Law. 


But the fundamental driver of bandwidth demand  is multiple users and multiple devices, more than the bandwidth required by any single app, any single user or device, even if some apps--such as video--increase bandwidth demand by at least two or three orders of magnitude compared to narrowband apps. 


The point is that home broadband bandwidth now is shared by multiple users, apps and devices. And that is why bandwidth demand keeps growing, aside from the use of more bandwidth-intensive apps and devices. 


“The number of devices connected in Xfinity households has skyrocketed 12 times since 2018, and the need for fast, reliable, and secure Internet will continue to grow,” said Bill Connors, President of Xfinity, Comcast Cable. 


The net effect is that every household now acts as a “multi-user” location. And that matters because any amount of bandwidth X is divided by the number of users, connected devices and apps in simultaneous use. In principle, that means Comcast customers require an amount of bandwidth that is X/12. 


source: Comcast 


We should look for continued increases in capacity, at about a Moore’s Law pace, for the indefinite future.


Monday, October 17, 2022

Are There Hard Limits on Home Broadband Growth?

How much more revenue can the internet access business generate, in markets that are near saturation (almost everybody who wants it already buys)? To be sure, internet service providers will keep boosting speeds and seek to add value to their service features. 


Home broadband has become an “essential” utility in many markets, so demand remains consistent. On the other hand, competition is growing, so retail prices can face pressure. And market share matters in near-saturated markets. 


Weigh everything and one might conclude that revenue growth is going to be difficult, even as customers are shifted to higher-cost plans, where possible. 


The fundamental limit is that households will only spend so much on internet access. Basically, households tend to spend between 1.5 percent to 2.25 percent of gross domestic product on communications services. 


Over time, household spending on connectivity services has fallen. Nor has business spending moved much, either.  


Think of any business. How much will they spend on marketing, sales, labor? The percentages might change a bit, over time. But those percentages are relatively fixed. Consumer spending does not change too much from year to year. 


Nor does the percentage of income spent on various categories change too much. 

source: IDC


In Myanmar, a new mobile market, spending per household might be as high as eight percent of total spending. In Australia, communications spending (devices and services) might be just 1.5 percent of household spending.  


In South Africa, households spend 3.4 percent of income is spent on communications (devices, software and connectivity). In Vietnam, communications spending is about 1.5 percent of total consumer spending.


In the United States, all communications spending (fixed and mobile, devices, software and connectivity, for all household residents) is perhaps 2.7 percent of total household spending. U.S. household spending on communications might be as low as one percent of household spending, for example. 


That means spending on communications services will tend to vary by revenue growth and the health of the economy. Some consumer demand also is shaped by new housing construction, as well. More homes mean more connections. 


The implication is that total market growth always is constrained on the demand side. That is not to say that demand growth is impossible: value can change over time. But value does not always correlate in a linear way with willingness to pay. 


The extreme examples are  luxury goods, where higher prices might actually increase demand (think yachts, jewelry, artwork).


For most products, higher value leads to higher price. But computing appliances and data services have been outliers. Products improve so rapidly (twice as capable every 18 months) that product obsolescence is built in. 


To the extent that internet access increases at Edholm’s Law or Nielsen's Law  rates, home broadband services at any speed are continually devalued. 


Edholm's Law suggests that bandwidth will increase at the same rate as Moore’s Law suggests transistor density will grow. Nielsen’s Law of Internet Bandwidth states that a high-end user’s connection speed grows by 50 percent each year, doubling roughly every 21 months.  


Cloonan's Curve predicts how much bandwidth a typical customer of home broadband services might actually buy. Cloonan’s Curve essentially describes home broadband consumer behavior.


Most customers do not typically buy the fastest-available service, as that also is typically the most-expensive tier of service. Instead, they tend to buy the mid-level service. 


The caveat is that Cloonan’s Curve obviously does not apply to service providers that sell only a single tier of service, at the advertised headline rate (“gigabit only,” for example). 

source: Commscope


This illustration of downstream bandwidth plans actually purchased by customers suggests that although both Nielsen and Cloonan rates increase at about 50 percent per year, most customers buy services that offer six times to 20 times less speed than the fastest-available service tier. 


But usage and price are not connected in linear fashion. Over time, cost per bit tends to decline with volume supplied. And, no matter what the volume supplied, retail prices only grow incrementally, at rates roughly in line with inflation, or below. 


In fact, there is evidence that internet access prices have dropped over the past two decades, in the U.S. market, for example. That is especially true when evaluating plans people actually buy, rather than retail tariffs. Looking only at posted retail prices, and not at actual behavior, can lead to significant distortions.


If the Connectivity Business Now is Part of "Computing," Does That Explain Fundamental Price Trends?

It is easy enough to note that the global data access business (wide area, metro area or local) is now part of the computing ecosystem, which in turns supports almost every sort of content, shopping, learning, entertainment or manufacturing activity you can imagine. 


Less obvious are the ways that integration shapes perceptions of value and retail pricing trends in the connectivity business. The old “telecommunications” business was based on scarcity: expensive networks hard to deploy and with competitive moats. 


The replacement “internet” business is based on abundance: ever-cheaper, ever-faster, ever-powerful processing and storage; ever-cheaper connectivity; easier digital replacements for a growing range of products. 


All observers would agree that, in general, prices for home broadband tend to fall over time, while capacity supplied tends to grow over time. That same trend is seen in wide area network -capacity, internet transit or interconnection prices or just about any measure of computing device or computing service prices as well.


The issue is why that should be so, aside from the fact that most home broadband markets are competitive, which should lead to better products, faster innovation and lower prices over time, as might be the case in any other market. 


But home broadband is not the only sort of product that shows that pattern: higher capability and flat to lower prices as a recurring practice. Computing and storage products famously show the same pattern. 


Home broadband unit prices seem to act as do computer unit prices: capability doubles every 18 months while price either remains the same, or drops. To be sure, in some cases other value drivers seem to be at work. Premium level smartphones actually seem to increase in price, in some cases. 


That may be an instance of prices reflecting higher perceived value for some appliances, compared to others. 


Also, in large part, consumer or business spending on connectivity services is limited for other reasons. Most households are only able to spend so much for connectivity; so much for computing appliances; so much for entertainment. Most of the household budget has to go for shelter, food, transportation, healthcare or other necessities. 


Some might argue that household spending on services and hardware is as much as five percent of household budgets.  


Asymco, Federal Reserve Bank 


Even that might be falling, over time. Demand is  relatively inelastic for communications. In other words, people will only spend so much for communications. As a percentage of gross domestic product, for example, communications spending by households fell between 2006 and 2019, for example. 

source: ETNO


The point is that there is only so much incremental growth possible in the home broadband business, once near-saturation levels in terms of subscriptions are reached, beyond new home construction, which grows the number of potential customer locations. At the firm level, growth eventually boils down to taking market share.


Sunday, October 16, 2022

Is Meta the First of Today's Computing Leaders to Falter as We Head for the Next Generation?

It often is asserted that the leaders in one era of computing technology are not the leaders in the next. Whether one looks at the market share leaders, the lead devices, network architectures or applications, computing eras lead to distinct business opportunities. 

source: Dr. James Coakley, Oregon State University


So to the extent that Amazon Web Services, Google, Azure, Facebook or Apple have been seen as leaders of the present era of computing, we should at least hold open the thought that this will not always be the case, as hard as that might be to fathom. 


Facebook--now Meta--might be the best example of how leadership is lost. It can be argued that Facebook’s pivot to metaverse is evidence that the traditional growth drivers of advertising are not expected to fuel the company’s continued growth. 


Perhaps even more oddly, Facebook’s traditional reliance on app layer advertising might arguably be said to be at risk as a new era with more reliance on appliances, devices and hardware could be dawning. 


Consider the oddity of that argument. Apple, over much of the last two decades, has had to shift to services and apps to diversify its revenue away from a reliance on devices and hardware. 


Now it might be applications-driven Meta that has to figure out a way to get into the hardware business. Consider that both Google and Amazon have developed important hardware and device businesses to support their application, advertising and commerce business models. 


Perhaps Meta’s big strategy shift is the first sign that the next wave of computing will feature different leaders.


If Home Broadband is a Computing Product, Price Trends Make Sense

Total worldwide telecom revenues from mobile and fixed broadband services will grow 14 percent  between 2022 and 2027 to reach €1.2 trillion according to  Omdia. But monthly Average Revenue Per User will fall by 4.2 percent from €7.48 in 2022 to €7.16 in 2027, India researchers say. 


You might think new 5G services and faster home broadband would lead to a different result. But that is not the historical record. According to the U.S. Bureau of Labor Statistics, prices. for internet services and electronic information providers are 19.49 percent lower in 2022 versus 1997. 


Between 1997 and 2022, internet services experienced an average inflation rate of -0.86 percent  per year, even as access speeds continued to climb steadily. 


source: Omdia 


Competition explains some of the results. Indirectly, lower costs per bit explain some of the pricing trends, as access networks work more efficiently over time. While lower costs per bit do not directly explain lower recurring costs, they help internet service providers maintain profit margins even when delivering more capacity. 


Pricing trends for other digital products, such as computing devices, also seem to dictate pricing policies. Personal computers and other devices tend to improve performance over time while retail sales prices retain roughly flat. 


source: Free by 50 


But it also seems to be the case that retail prices for internet access are shaped by wide area network costs; lower costs of computing generally and by ISP pricing practices, which are not strictly usage-based. 


Though mobile operators do sell packages of usage that vary by “amount consumed,” the relationship between units consumed and price-per-unit drops with higher volume. 


Fixed network operators tend to price on advertised headline speed, not consumption. Historically, higher speeds have always led to higher data consumption, so higher speeds almost automatically come with lower unit prices. 


Ultimately, it seems Moore’s Law seems to be at work--not as a principle related to transistor density--but as a description of retail pricing. Since customer spending is never unlimited, we see doubling of capability every 18 months or so, while prices drop or remain the same. 


Internet access essentially is valued as a computing product. Retail prices, at least, suggest that form of valuation by customers. And that means higher capability at constant or lower prices will be expected. 


Competition matters, of course. But global prices for internet access seem to exist, as though the product were oil, where prices are inherently globally set. Local levels of competition matter, but overall, prices seem to act as though global norms prevaill.


Saturday, October 15, 2022

Home Broadband Prices Generally Drop Globally, With Some Exceptions

This chart showing typical monthly costs and typical speeds illustrates why the internet access business is so challenging. Note that typical monthly charges are the same, whether we compare slow copper connections or faster cable TV and telco connections using optical fiber. 


In other words, there is a tendency in the internet access business for capacity supplied to grow but for revenue to remain flat. 


source: Point Topic


Keep in mind that this study of published tariffs shows “average” prices across a range of products using the pricing power parity method, which normalizes prices across countries to account for currency effects. 


source: Point Topic


In the absence of specific detail on whether median or mean figures are used, I assume the stated prices and speeds use the mean. But the biggest impact on stated prices is the use of PPP to normalize local prices across countries. 


One often hears that the typical U.S. home broadband account generates $50 per month. Using PPP, that normalizes to $94 per month. Other countries whose monthly recurring charges often appear to be lower, are higher when using PPP. 


In most regions, prices are dropping. In South and East Asia prices are stable. Only in North America are prices rising. That appears to be a byproduct of customers migrating to higher-priced service packages that run at faster speeds, as well as speed increases by ISPs. 


In the first quarter of 2022, for example, about half of accounts operated at speeds between 200 Mbps and 400 Mbps. A year earlier, half of customers purchased plans operating between 100 Mbps and 200 Mbps, according to Openvault data. 

Friday, October 14, 2022

Faster Home Broadband Just Keeps Coming, As Edholm and Nielsen Laws Predict

Google Fiber will launch 5-Gbps and 8-Gbps internet access service in early 2023. Both products will offer symmetrical upload and download speeds, Google says. 


Google Fiber launched gigabit service in 2010, 2-Gbps service in 2020 and (and is testing 20-Gbps service. 


The 5-Gbps tier will cost $125 per month, while the 8-Gbps tier will cost $150 per month. 


Separately, it seems increasingly likely that Comcast will begin to introduce service at speeds possibly in the 4-Gbps to 6-Gbps range in 2023. And those services might well be symmetrical, able to extend to 10-Gbps symmetrical. 


Those speed increases are predictable and expected according to two theorems. 


Nielsen's Law suggests that the top-end speed will grow 50 percent per year. Edholm’s Law states that internet access bandwidth at the top end increases at about the same rate as Moore’s Law, which is about a doubling every 18 months or so. 


That means the top-end home broadband speed could be 85 Gbps to 100 Gbps by about 2030. 

source: NCTA  


Nielsen Norman Group estimates suggest a headline speed of 10 Gbps will be commercially available by about 2025, so the commercial offering of 2-Gbps and 5-Gbps is right on the path to 10 Gbps. 


AT&T, for example, just activated symmetrical 2-Gbps and symmetrical 5-Gbps service for 5.2  million locations across 70 U.S. markets, with plans to deploy across the whole footprint in 2022 and later years. 


There is widespread expectation that the headline speed for home broadband, in many markets, will be 10 Gbps by about 2025. 


By other rules of thumb, that also suggests the "typical" home broadband customer will be buying service at rates between 1 Gbps and 2 Gbps, with a significant percentage buying service at 4 Gbps. 


Nielsen’s Law has operated since the days of dial-up internet access. Even if the “typical” consumer buys speeds an order of magnitude less than the headline speed, that still suggests the typical consumer--at a time when the fastest-possible speed is 100 Gbps to 1,000 Gbps--still will be buying service operating at speeds not less than 1 Gbps to 10 Gbps.  


source: FuturistSpeaker 


So top end speeds in the terabits per second are virtually inevitable by about 2050. The emergence of offers between 2 Gbps and 5 Gbps now is simply evidence that the trend continues. 


At the moment, top speeds in the U.S. market are in the 2 Gbps and 5 Gbps ranges.Comcast has introduced 3-Gbps services for business. Ziply has introduced symmetrical 2-Gbps service. Google Fiber has added 2-Gbps as well. 


Frontier Communications is doing the same. Verizon offers 2-Gbps Fios service. AT&T sells both 5-Gbps and 2-Gbps service. Many of those offers feature symmetrical bandwidth


Perhaps the greatest value change, though, is not the headline downstream speed, but the symmetrical speeds, as in the U.S. market asymmetrical services sold by cable operators have nearly 70 percent market share. 


Though the cable hybrid-fiber coax networks can be configured to support more upstream bandwidth, fully-symmetrical service typically requires switching to fiber-to-the-home platforms. 


To scale new capital investments, cable operators in many cases will choose to extend downstream speeds and lift upstream speeds, approaching or reaching fully symmetrical service with DOCSIS 4.0 before considering other measures such as switching to FTTH. 


If the “typical” customer buys a service operating at up to an order of magnitude less than the highest headline speed, we might infer that the typical home account--offered by ISPs with various speed plans--will be buying service at speeds between 500 Mbps and 800 Mbps in 2025. 


Keep in mind that Google Fiber’s footprint is quite limited, so not many households will be able to buy Google Fiber service, now generally available at either 1-Gbps or 2-Gbps speeds. In such cases, the headline speed and the median speed tend to be virtually identical. 


The real local market test will tend to be the 2-Gbps to 5-Gbps services sold by Comcast, which has the biggest home footprint, or AT&T, with perhaps the third-biggest footprint. But those services are marketed mostly to business customers, at this point. 


Will Video Content Industry Survive AI?

Virtually nobody in business ever wants to say that an industry or firm transition from an older business model to a newer model is doomed t...