Friday, April 14, 2023

Why Many "Digital" Firms Must Use Non-Traditional Proxies for Success

There is a good reason why many applications use non-traditional metrics for measuring progress: the sources of their value do not map with traditional financial metrics in a direct way. We sometimes think that is true of “software” companies or “digital” firms, but that is partly a coincidence. 


The internet, layered software and virtualization allow most firms to conduct their existing businesses in different ways, without changing the traditional performance metrics. 


Platform businesses, on the other hand, necessarily must account for their success at creating ecosystems of value creation, which are not measurable using standard accounting conventions. 


That is why we often see metrics that are proxies for user engagement, such as daily active users or monthly active users. We might see citations of time spent on the platform. Perhaps we see data on conversions of visits to sales of merchandise. 


Uber might cite gross bookings paid by rider, or the number of trips riders take, the number of drivers or the number of riders per day or month. 


Airbnb might cite nights booked, gross booking value, host earnings or average daily rates as evidence of success. 


Amazon Marketplace and eBay will cite gross merchandise volume. Amazon might point to units sold, customer satisfaction ratings. 


Ebay might track active buyers or seller ratings. 


Since network effects are critical, we might see numbers about growth in the number of producers, merchants, properties, drivers, listings. We might see evidence of success in terms of growing gross merchandise sales, rides, rentals or other metrics about buying volume. 


User abandonment of the platform also could matter, so we might see evidence provided about churn rates declining. 


Connecting domains in the internet era provides an example of the “death of distance” in wide area networking. 


But non-GAAP metrics have grown in importance, even for firms not using platform business models. Competitive local service providers once cited metrics such as “voice grade equivalents” to show sales progress, at a time when service providers were early into the process of measuring bandwidth supplied--rather than voice lines in service--as a proxy for performance. 


Average revenue per account, or average revenue per unit, now are proxies for progress in boosting revenue. Churn rates also became important in competitive markets, where lost customer accounts also tended to mean that a competitor gained an account. 


For similar reasons, customer acquisition cost became an important and relevant metric. 


These days, marketing battles are fought over metrics such as internet access speed, rather than voice quality; outage performance rather than voice quality. 


Consider also that wide area transport of data was charged using distance and capacity as the cost drivers. These days, distance is basically not a significant driver of cost. Instead, interconnection bandwidth tends to drive prices. 


In fact, large domains often agree to “peer” without major recurring cost, exchanging traffic between domains without costs related to traffic volume, as it is expected that inbound and outbound traffic will roughly balance on an annual basis. 


None of those are standard financial reporting categories, but are important proxies for business success.


Thursday, April 13, 2023

Do ISPs Really Suffer From High Data Demand?

When access providers complain about their revenues not keeping pace with the infrastructure they must build to support their own customer requirements, that argument arguably makes more sense for fixed network home broadband than mobile internet access, looking at mobile data consumption and mobile operator service revenues as analyzed by Omdia. 


Granted, mobile networks are less capital intensive than fixed access networks, but mobile data consumption and mobile data revenue growth are not inversely related. Granted, traffic growth is happening at a faster rate than revenue growth, but the revenue trend still is positive. 


source: LightReading, Omdia


Some of us might argue that even that trend is misleading, in the sense that it is mobile operator customers who are invoking delivery of nearly all that data, as they watch streaming video, listen to streaming audio or interact with image-rich social media sources.  


To the extent that networks are supposed to compensate each other for use of facilities, the asymmetrical flow of data between customers on one network--who request content delivery from sources on other networks--might be viewed as an application of the “calling party pays” arrangement. 


In such content sessions, it is the calling party that creates the data demand by invoking delivery of content from a remote network. Only by ignoring that reality can it be claimed that the content delivery network is the “calling party.”


Assume the internet value chain represented about $6.7 trillion in annual revenues, as estimated by Kearney and GSMA. Assume internet access revenue was about 15 percent of that total amount, or about $1 trillion earned each year providing internet access. 


Assume global revenue earned by “telcos” was about $1.5 trillion, as estimated by IDC. That implies that as much as 66 percent of total telco and ISP revenue earned annually was generated by internet access.


Even if that is a high estimate, it suggests the importance of internet access for telco and ISP revenue and profits. 


It is impressionistic, but even if data demand grows at faster rates than access revenue, logic would suggest that profit margins for internet access are likely higher than for many other services including business data networking, video services or mobile messaging and voice. 


Perhaps only legacy voice services, which generally speaking are harvested, requiring minimal new capital investment, might have margins higher than internet access. 


Some 40 years ago, linear video might have produced margins in the 40-percent range, where today most providers would be lucky to see 10-percent margins. 


By some estimates voice service margins in 1980 were as high as 50 percent. Mobile voice margins might have been in the 30-percent range in 1980 and might be as low as five percent today. 


But even if we use a blended rate of 10 percent for ISP and telco service margins, internet access, as the largest product category, still produces the greatest volume of profits. 


Again, it might only be illustrative, but ISPs might well be making average profits on their internet access services, but up to two thirds of gross revenues on those services. 


We can argue about the cost of delivering capacity now, compared to 49 years ago, but nobody would question that the cost to deliver a bit has declined dramatically over that period. 


In that sense, the total capacity demand generated by an ISP’s customers might not matter as much as often portrayed. What matters more is the contribution internet access makes to total revenues and profit margins. 


To the extent that traffic asymmetries exist between access providers in different regions, those traffic flows are mostly dictated by the location of content servers and the end user locations where people are requesting delivery of content. 


So whether one agrees that content delivery is a remote response to a local customer’s requests, or is an unrelated part of a single session, it is not so clear that ISPs literally have a broken business model. As content servers are deployed “closer to the edge” over time, asymmetrical data flows arguably could be reduced.


Tuesday, April 11, 2023

Video Calling Now Among the Top-three Mobile Phone Activities

Technology forecasts can be notoriously incorred, but on timing and adoption. Consider video calling, something that consumers do fairly regularly now.


Despite the many predictions about video calling, that use case was not a mass market and routine use case until recently, when the Covid pandemic forced people to start using it. 


AT&T, for example, demonstrated Picturephone at the 1964 World’s Fair, but adoption never happened. 


source: Time


Not until the Covid pandemic forced people to work from home and students to learn from home was there mass adoption of video calling services such as Zoom


A recent survey of user behavior in 2021, however, shows that video calling follows only instant messaging and voice calling as an activity on a mobile phone.   


source: GSMA Intelligence

How Much is Home Broadband About Physical Media?

Knowing what physical media is used by an access network does not necessarily tell one much about actual capacity or expected customer speed experiences, on any access network. Nor does physical media necessarily drive customer choices in an exclusive way. 


Personally, I’d buy a gigabit service provided by any network compared to an FTTH network supplying less capacity than that. Media does not matter, in that regard. Of course, price, upstream capacity and other issues play a part in such decisions. 


The point is that we sometimes fetishize FTTH, when we should be looking also at speed and other elements of the customer experience. Before FTTH became available, I’d assumed most people would prefer to buy it. In the abstract, that makes a good deal of sense: it’s the better network, right?


But price-value relationships matter. FTTH availability is one matter; buying decisions are driven by a much-wider set of considerations. 


Even though we conventionally assume fiber to home is much faster than copper access, with other platforms such as geostationary satellite, low earth orbit satellite, fixed wireless or hybrid fiber coax somewhere between copper and fiber home broadband platforms, FTTH networks can be activated at a range of speeds. In some cases, FTTH might not represent the fastest-available home broadband choice. 


So comparisons and targets are, in one sense, better evaluated in terms of speed capabilities and price-value relationships, matched by consumer buying behavior. What a policymaker wants is gigabit speeds or multi-gigabit per second speeds, not access media as such. 


There always seems a gap between customer preferences and internet service provider offers. In markets with strong cable operator competition, for example, FTTH tends to get between 40 percent penetration and 45 percent adoption after about three years of marketing. Some FTTH ISPs hope to reach a terminal adoption rate of 50 percent, but that is about the extent of expectations. 


source: IDATE, TelecomTV


Data from other European markets shows similar gaps between facilities deployment and take rates, where take rates hover between 45 percent and 47 percent. And that is a view of physical media choices, not necessarily speed tiers chosen by customers. 


In the U.S. markets, as well, many consumers choose not to buy the “fastest” tiers, but rather tiers someplace in the middle between fastest and slowest. 


source: OpenVault


The point is that enabling fast home broadband networks is one matter; customer demand is another matter. At any given point in time, it is likely that a majority of customers buy services in the middle ranges of capability; not the fastest and not the slowest. 


Consider U.K. fiber to premises networks, where “superfast” networks, by definition, operate at a minimum of 24 Mbps to 30 Mbps. Perhaps 42 percent of U.K. premises can buy FTTH-supplied home broadband. 

source: Uswitch 


Project Gigabit is a UK Government program aimed to bring £5 billion worth of investment to the country’s home broadband infrastructure. The aim is to bring gigabit-capable coverage to 85 percent of the U.K., and maximize coverage in the 20 percent of  hardest-to-reach locations by 2025. 


Based on past experience, it is safe to predict that, at some point, most customers will buy services at the gigabit per second level, just as most now buy services operating at about 30 Mbps. Just as safely, we can predict that, at some point, most customers will buy multi-gigabit per second services as well. 


We sometimes forget that during the dial-up era, people bought services topping out at perhaps 56 kbps in 1997. By 2000, typical speeds had climbed to 256 kbps; by 2002 reaching 2.544 Mbps. 


source: NCTA 


By 2005, typical speeds were in the 8 Mbps range; by 2007 speeds had climbed to about 16 Mbps. By about 2015 we began seeing advertised speeds of 1 Gbps. 


In all those eras save the dial-up period, the top speeds were not purchased by most people. Capabilities are important, to be sure. But consumer demand also matters. 


It is not necessarily a policy failure if most customers choose not to buy a particular product. 

source: Uswitch 


In competitive markets where gigabit alternatives are available on other platforms, FTTH take rates often hover around 40 percent of locations passed. If FTTH were clearly the superior choice, in terms of price-value, take rates would be higher. 


How that changes in the future is a reasonable question, especially in markets with facilities-based competition. In markets with but a single network provider, but multiple retail competitors using one network, FTTH take rates could be much higher, even if market share held by any single contestant 


Monday, April 10, 2023

Why Industry Rebranding Will Mostly Fail

"The more things change, the more they stay the same" might well apply to the connectivity business, despite all efforts to rebrand and reposition the industry as having a value proposition based on something more than "we connect you."


Consider the notion that 6G mobile networks will be about “experience,” as suggested by Interdigital and analysts at Omdia. At some level, this is the sort of advice and thinking we see all the time in business, where suppliers emphasize “solutions” rather than products and virtually all suppliers seek to position them as providers of higher-order value. 


The whole point of home broadband or smartphones with fast internet access is that those capabilities support the user experience of applications. 


And many have been talking about that concept for a while. “The end of communications services as we know them” is the way analysts at the IBM Institute for Business Value talk about 5G and edge computing, for example. 


To be sure, connectivity is not the only business where practitioners are advised to focus on end user benefits, solutions or experiences. But connectivity is among businesses where perceived value, though always said to be “essential” to modern life, also is challenged by robust competition and the ability to create product substitutes. 


One of the realities of the internet era is that although end user data consumption keeps climbing, monetization of that usage by communications service providers is problematic. Higher usage might lead to incremental revenue growth, but at a rate far less than the consumption rate of growth.


That is the opposite of the relationship between consumption and revenue in the voice era, when linear consumption growth automatically entailed linear revenue growth. Though there was some flat-rate charging, most of the revenue was generated by usage of long-distance calling services. 


“On the surface, exponential increases in scale would seem like a good thing for CSPs, but only if pricing keeps pace with the rate of expansion,” the institute says. “History and data suggest it will not.”


Indeed, Nokia Bell Labs researchers have been saying for some time that "creating time" 

is one way of illustrating the difference between core value propositions in the legacy and today’s market. “We connect you” has been the traditional value prop. But that could shift to something else as “connectivity” continues to face commoditization pressures. 
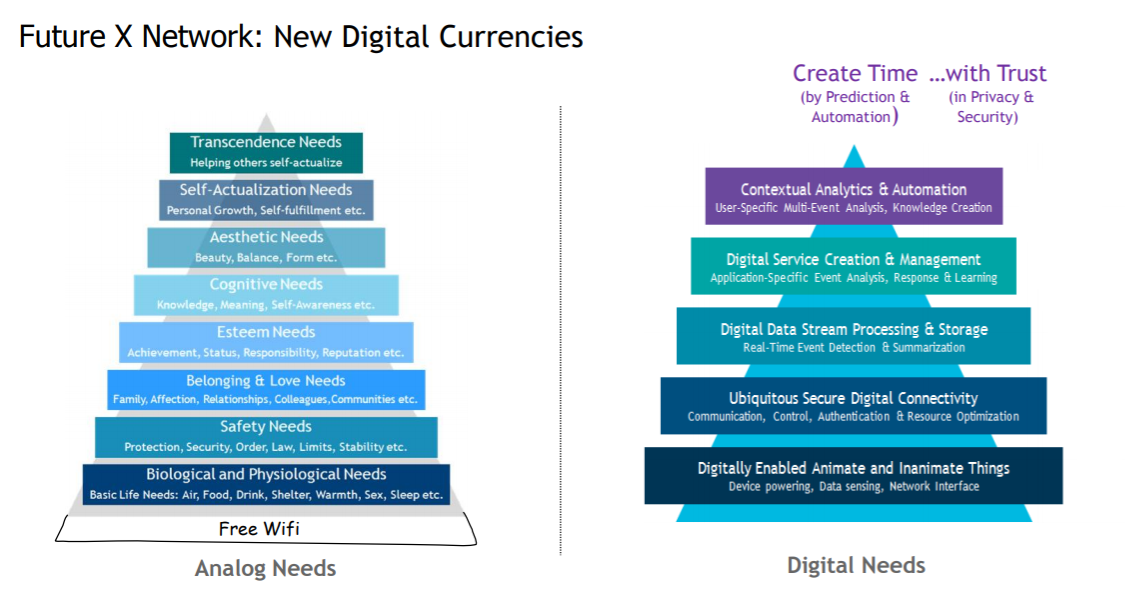
source: Nokia Bell Labs  


The growing business model issue in the internet era is that conventional illustrations of the computing stack refer only to the seven or so layers that pertain to the “computing” or “software” functions. Human beings have experiences at some level above the “applications” layer of the software stack, and business models reside above that. 


Likewise, physical layer communication networks and devices make up a layer zero that underpins the use of software that requires internet or IP network access. The typical illustration of how software is created using layers only pertains to software as a product. 


Software has to run on appliances or machines, and products are assembled or created using software, at additional layers above the seven-layer OSI or TCP/IP models, in other words.


So we might call physical infra and connectivity services as a “layer zero” that supports software layers one to seven. And software itself supports products, services and revenue models above layer seven of the software stack. 


Some humorously refer to “layer eight” as the human factors that shape the usefulness of software, for example. Obviously, whole whole business operating models can be envisioned using eight to 10 layers as well.  
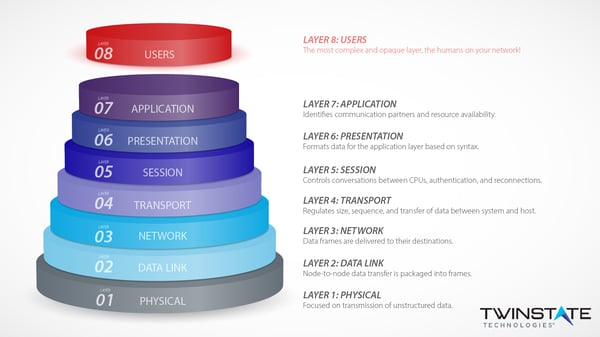

source: Twinstate 


The point is that the OSI software stack only applies to the architecture for creating software. It does not claim to show the additional ways disaggregated and layered concepts apply to firms and industries. 
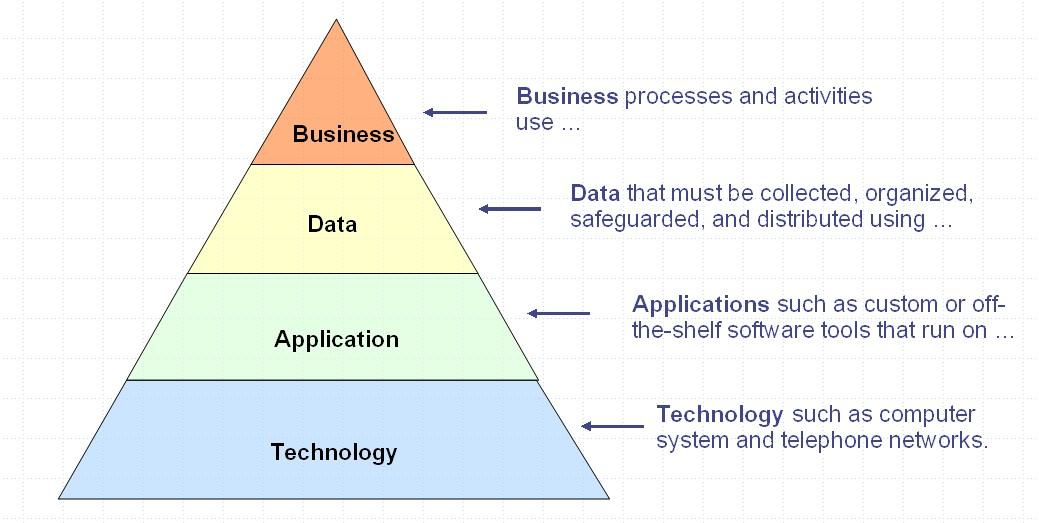

source: Dragon1 


Many have been using this general framework for many decades, in the sense of business outcomes driving information and computing architecture, platforms, hardware, software and communications requirements. 
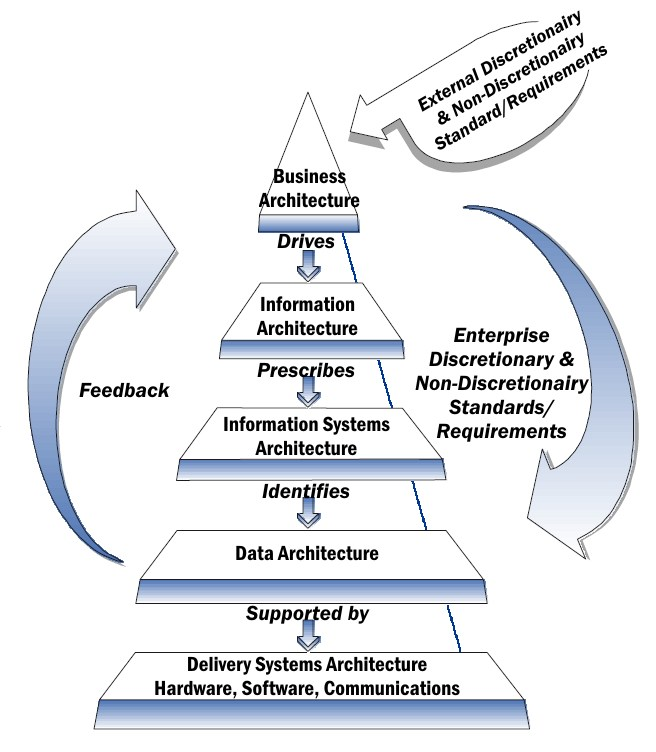

source: Wikipedia


In a nutshell,  the connectivity industry’s core problem in the internet era is the relative commoditization of connectivity, compared to the perceived value create at other layers. 


Layer zero is bedeviled by nearly-free or very-low-cost core services that have developed over the last several decades as both competition and the internet have come to dominate the business context. 


Note that the Bell Labs illustration based the software stack on the use of “free Wi-Fi.” To be sure, Wi-Fi is not actually free. And internet connectivity still is required. But you get the idea: the whole stack (software and business) rests, in part, on connectivity that has become quite inexpensive, on an absolute basis or in terms of cost per bit.  


Hence the language shift from “we connect you” to other values. That might include productivity or experience, possibly shifting beyond sight and sound to other dimensions such as taste and touch. The point is that the industry will be searching for better ways to position its value beyond “we connect you.”


And all that speaks to the relative perception of the value of “connections.” As foundational and essential as that might be, “mere” connectivity is not viewed as an attractive value proposition going forward. 


It remains to be seen how effective such efforts will be. The other argument is that, to be viewed as supplying more value, firms must actually become suppliers of products and solutions with higher perceived value.


And that tends to mean getting into other parts of the value chain recognized to supply such value. If applications generally are deemed to drive higher financial valuations, for example, then firms have to migrate into those areas, if higher valuations are desired.


If applications are viewed as scaling faster, and producing more new revenue than connectivity, and if suppliers want to be such businesses, then ways should be sought to create more ownership of such assets. 


The core problem, as some might present it, is that the “experience” benefits are going to be supplied by the apps themselves, not the network transporting the bits. It is fine to suggest that value propositions extend beyond “connectivity.” 


source: Interdigital, Omdia


The recurring problem is that, in a world where layers exist, where functions are disaggregated, connectivity providers are hard pressed to become the suppliers of app and business layer value. So long as connectivity exists, value and experience drivers will reside at higher layers of the business stack. 


Unless connectivity providers become asset owners at the higher levels, they will not be able to produce the sensory and experience value that produces business benefits. Without such ownership, the value proposition remains what it has always been: “we connect you.”


If so, the rebranding will fail. Repositioning within the value chain, even if difficult, is required, if different outcomes are to be produced.


So long as humans view the primary communications industry value as "connections," all rebranding focusing on higher-order value will fail. It is the apps that will be given credit for supplying all sorts of new value.


Saturday, April 8, 2023

How Much can Meta Compress its Hierarchy?

Meta’s effort to flatten management does raise logical questions about effective span of control in technology organizations. The span of control refers to the number of direct reports any single manager can effectively handle.  


In this simple illustration, a larger organization has multiple layers of direct reports, while a simple organization might have only one layer of direct reports. Any large organization is going to have a “tall” structure. 

source: OrgChart 


But the span of control is always limited to a small number of direct reports, usually described as topping out around seven people. Any large organization, therefore, is going to have lots of people who are essentially "managing managers." 


To be sure, spans might differ from firm to firm, based on the functional activities each engages in. The military span of control, for example, might be different from that of technology organizations.


The actual span of control arguably varies by the type of tasks to be managed. Highly unstructured work might have a limit of three to five direct reports. 


Highly-structured work, such as in call centers, might allow spans as large as 15 or more. The point is that the span of control is always sharply limited. So any large organization is going to have many people who are essentially managing other managers.

Can

How Much Can Tech Firms Flatten Span of Control?


Meta’s effort to flatten management does raise logical questions about effective span of control in technology organizations. The span of control refers to the number of direct reports any single manager can effectively work with.


To be sure, spans might differ from firm to firm, based on the functional activities each engages in. The military span of control, for example, might be different from that of technology organizations.


But span of control always is limited to a small number of direct reports, usually described as topping out around seven people. Any large organization, therefore, is going to have lots of people who are essentially "managing managers." 


The actual span of control arguably varies by the type of tasks to be managed. Highly unstructured work might have a limit of three to five direct reports. 


Highly-structured work, such as in call centers, might allow spans as large as 15 or more. The point is that spabn of control is always sharply limited. So any large organization is going to have many people who are essentially managing other managers.


Directv-Dish Merger Fails

Directv’’s termination of its deal to merge with EchoStar, apparently because EchoStar bondholders did not approve, means EchoStar continue...