Tuesday, January 5, 2016

App Providers Lead Equity Value Gains, Access Providers Generally Fall

There is one very good reason why practitioners in the traditional telecom industry are riveted on value creation, as much as they have to focus on revenue growth and profit margins. With the shift to Internet Protocol, value created by applications is logically separated from access.


In that sense, the layered software model also illustrates the change in potential business models: an app provider does not need to own access assets to prosper. The reverse likely is less true: access providers will have a much-tougher time creating value that drives margins.


“The traditional telecom industry (and their partners such as IBM and Accenture) is losing to new entrants at a rapid rate: first in applications, then in voice-over-Internet protocol and managed hosting, and now in cloud services,” says Jim Patterson is CEO of Patterson Advisory Group.


“Wireless services have produced tens of billions of dollars in value, but that pales in comparison to the value created over the last decade by Facebook, WhatsApp, Skype, YouTube, Chrome, Android, iOS and iTunes,” Patterson notes.


Note simply the divergence in access provider and app provider equity prices over the last year. Amazon’s equity value was higher by 118 percent. Google’s equity value grew “just” 44 percent. Facebook’s equity value was higher by 32 percent over the last year.


By way of contrast, Verizon was lower by one percent, AT&T up just two percent, Sprint down 13 percent, and just T-Mobile US up by 45 percent. CenturyLink dropped by 36 percent; Frontier Communications dipped 30 percent.


source: RCR

CES, AT&T Shift to Internet of Things, Connected Cars

The Consumer Electronics Show once was lead by televisions as the key product category. Then CES became a show focusing on personal computers. Then came mobility. Now CES is about connected cars, part of the Internet of Things category.

AT&T signed more than 300 Internet of Things connected devices deals in 2015, in the United States and internationally, to connect sensors and other telemetry devices across the automotive, shipping, industrial, health care, home security and smart cities sectors.

In the United States, about 25 million connected devices are now on the AT&T network, a year-over-year increase of more than 25 percent when compared to the third quarter of 2014.  

In the third quarter alone, AT&T added a record of more than 1.6 million connected devices. Of that number, one million--fully 63 percent--were connected cars.

Also, AT&T is introducing a new family of Long Term Evolution modules to meet the needs of a broad range of Internet of Things applications. The modules are designed to simplify and lower the cost of IoT device designs globally, while improving device performance.

The new modules can run over the AT&T 4G LTE network. An LTE-only option offers low current to improve device battery life, which is important for some IoT applications.

Other module variants include built-in GPS, voice and data. Modules are available that support both 4G and 3G networks for IoT devices that need the ability to use either technology.

AT&T worked with Wistron NeWeb Corp. (WNC), a module and device manufacturer, to design the new LTE modules. They use an industry standard surface-mount package specified by the European Telecommunications Standards Institute (ETSI).

The M14A2A – LTE Only Category 1 can limit the amount of battery drain on an idle device compared to other LTE modules. Where 3G fallback is needed, WNC offers options such as the M14Q2 – Category 1 and M18Q2 – Category 3.

The IoT modules are expected to become available from WNC at prices planned as low as $14.99 each, plus applicable taxes, starting in the second quarter. Samples will be available for testing in the first quarter.

Monday, January 4, 2016

"Four" Versus "Three" in U.K. Mobile: Will Prices Rise if Consolidation Happens?

“Four” and “three” remain the most-important numbers in the global mobile service provider business. As European Commission regulators review the proposed merger of Telefonica-owned O2 and Hutchison Whampoa-owned Three, there is concern in some quarters that reducing the number of leading mobile service providers in the United Kingdom would lead to higher prices.

The merger would reduce competition from four leading providers to three, with the new company having 40 percent market share.

In Austria, the cost of running a mobile has gone up by an average of 15 percent following a 2012 merger between two of its four telecoms operators, another recent example of market consolidation from four to three.

Many financial analysts would argue that is precisely the point. Four national mobile service providers has proven to be a difficult structure, in terms of long term sustainability, some would argue, since the level of competition reduces profits below levels consistent with long term and continual investments.

U.S. regulators likewise have argued that four is a better number than three, in terms of competition and consumer benefit.

The issue is whether that is sustainable, long term. One might note that the share of revenue within the mobile service provider industry (separate from revenues earned directly by app providers) has been shifting in the direction of device and app suppliers since 2000.

At the same time, one might argue that the U.S. four-provider market has become a duopoly, with AT&T and Verizon at the top, and Sprint and T-Mobile US struggling to catch up.


Saturday, January 2, 2016

Mobile and Internet Access Services Are Way More Affordabble Since 2000

It is harder than one generally thinks to describe the change in cost of mobile or Internet access services over time, or how expensive or affordable such services might be, across regions and countries.

That is why various concepts, such as purchasing power parity, often are used. But one method is to use a consumer price index (CPI), within a single nation, to describe relative price changes over time.

According to the U.S Federal Communications Commission, for example, since December 1997, the mobile CPI has declined nearly 45 percent, while the overall CPI has increased by 36 percent.

In other words, mobile prices declined 81 percent from the general level of prices.

Mobile service prices have continued to decline in recent years, as well.

From December 2013 to December 2014, the annual mobile service CPI decreased by 2.1 percent while the overall CPI increased by 1.6 percent.

It is harder to describe CPI changes for Internet access, since no CPI can track changes in quality, which is the typical way Internet access products improve.

If prices stay flat, but speeds increase by two orders of magnitude, the CPI remains flat, even if real world users would say value has gotten much better.

According to the International Telecommunications Union, fixed and mobile Internet access prices have fallen in developing regions, while remaining low and flat in developed markets, expressed as a percentage of gross national income per person.


Prices expressed as cost per gigabyte also has improved by two orders of magnitude between 1999 and 2012, for example.


How Facilities-Based Competition Dramatically Increases Business Risk

Facilities-based competition in access markets qualitatively increases business risk.

Consider sales expectations in a monopoly environment. If voice adoption was high--90 percent to 95 percent--revenue per passed location was a number nearly identical to revenue per customer location.

All that changes when there are two or more competitors with roughly equal capabilities and market share.

The business model for fiber to premises networks using industry-standard fiber-to-home platforms provides a clear example.

Depending on the deployment situation, the cost per location might range somewhere between a high of US$2,250 per site and US$660 per location on the lower end, including activated drops, but not including any required customer premises equipment.

Assume an “average network cost” of $1455 per location passed. If customer adoption is 95 percent, then the “per-customer” cost is about $1528.

In a duopoly market, the investment costs are radically different. Assume the network is expected to have a 50-percent adoption rate (one out of every two locations buys at least one service). Then the per-customer cost is $2910.

The economics obviously get worse in a three-provider market where expected take rates are 33 percent (again assuming three equally-skilled and capitalized competitors). In that scenario, a new provider might have to expect network costs of $4365 per actual customer.

You readily can see the business model problem. In a monopoly environment, per-customer network cost is just $1455. In a duopoly  market the per-customer network cost might be $2910. In a three-provider market, network cost might be as high as $4365 per customer.

In other words, investment in a monopoly environment is three times higher, per customer, in a three-contestant market, and roughly twice as high as in a duopoly market.

Against that, assume $70 to $130 of revenue, in some cases. Over a three-year period, that is about $2520 to $4680 in revenue, per customer.

By rough estimate, assuming a customer life cycle of 36 months, the network might not even break even over three years, based solely on network costs.

Some U.S. ISPs, such as Sonic.net, are retailing gigabit connections plus voice for $40 a month, though. That implies three-year revenue of just $1440 per subscriber.

Assume a smaller operator could manage to connect a customer and activate service (including customer premises equipment) for about $300, where a telco connection might cost as much as $800.

So add network cost, plus service activation cost, of only $300 per site. That implies direct network-related activated customer investment of $1755 in the monopoly case, $3210 in the duopoly case and $4665 in the three-provider market.

Assume the ability to earn $130 a month of revenue requires selling video entertainment services, with higher customer premises equipment investment. So then use the $800 per customer figure for an activated location.

That implies monopoly scenario investment in network and CPE of $2255, growing to $3710 in the duopoly case and $5165 in the three-provider scenario. Recall that a three-year customer life cycle at $130 a month represents $4680 in account revenues.

All of that is before operating costs, franchise payments and marketing. Clearly, service providers are counting on longer customer life cycles, incrementally higher revenues and muted operating costs, to make the business case work.

The fundamental point is that the economics of a competitive fixed network business case are radically more difficult than in a monopoly environment.

Three Decades of Telecom Disruption

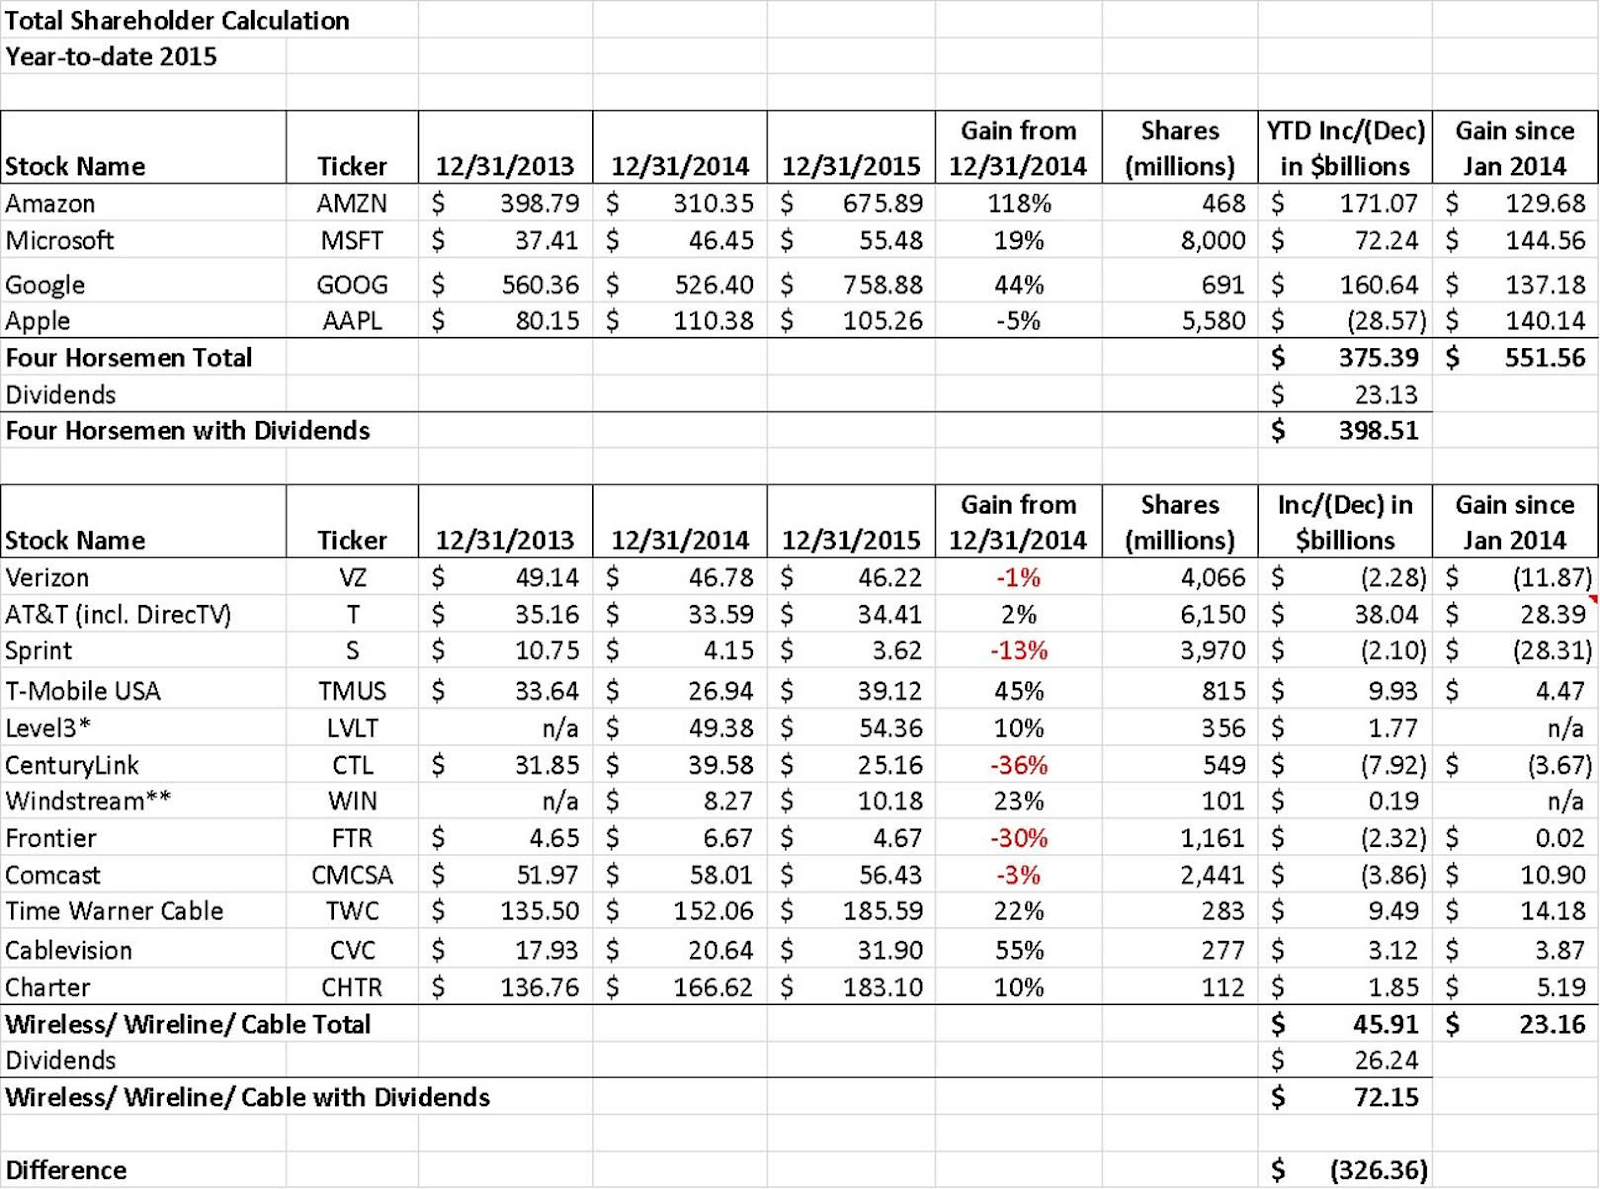
To say the global telecom business is “different” now since a wave of worldwide deregulation, privatization, investment and emergence of the Internet is a vast understatement. But consider just a few of the biggest changes.

Pre-1980, most national telecom infrastructures were dominated by a single monopoly provider, often owned by the government. In fact, telecommunications was widely believed to be a natural monopoly.

So prices were high, profit margins were high, innovation was low, revenue growth very limited, and the size of the market quite stable.

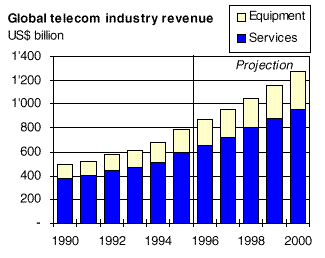
After deregulation and privatization, prices dropped dramatically, investment increased, total revenue increased, profit margins dropped and rates of innovation climbed dramatically.

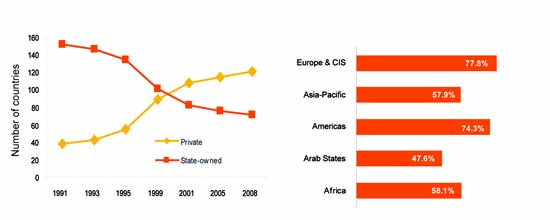
In 1991, state-owned telcos numbered about 150. By 2008, that number had dropped to about 70, according to the International Telecommunications Union. By 2008, some 125 nations had fully or partially privatized former state-owned telecom companies, lead especially by mobile operations.

At the same time, the emergence of the Internet and mobility reshaped platforms, the way applications are developed, the power and influence wielded within the ecosystem, business models and value drivers.

At the same time, communications capabilities were rapidly extended to those who previously had no access, rather suddenly transforming a market where perhaps half the world’s people could not “make a phone call” to a world where most adults now have such access, after just a few decades.

And while a similar change, allowing everyone Internet access, is only now underway, it is reasonable to expect that challenge also will be solved, more rapidly than anyone originally might have believed possible.

Three Decades of Disruption
1980
2015
Natural monopoly
Oligopoly
High margin
Moderate to low margin
Low to moderate adoption
High adoption
Low innovation
High innovation
Stable markets
Unstable markets
Compete on quality
Compete on price
Fixed network dominates
Mobile network dominates
Tightly integrated apps and network
Open network
Voice business model
Internet access, mobile business model
Similar business models globally
Growing diversity of business models
99.999% uptime
99.9% or “good enough” availability
Few lead apps
Many lead apps

End of Natural Monopoly

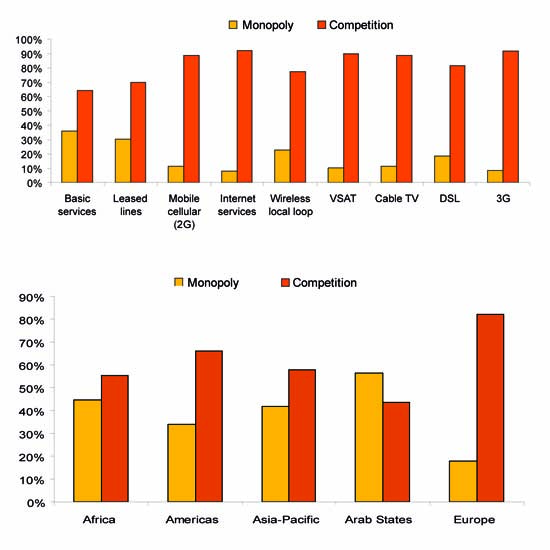
It is worth remembering that, until the 1980s, most analysts and regulators assumed telecommunications was a natural monopoly, akin to roads, bridges, sewer services, water and electrical services.

The corollary was that “competition” was believed not to be possible.The best regulators believed they could do was manage the social contract, balancing monopoly supply with price and profit controls.

In wider context, the 1980s was a time of new thinking about regulation of businesses formerly thought of as natural monopolies. In a growing number of instances, regulators decided telecommunications actually was not a natural monopoly, and began deregulating the business.


In many markets, especially with the advent of mobility, we now see that telecommunications is not, in fact, a natural monopoly. There is at least some room for facilities-based competition, though the number of viable contestants will be limited.

That does not generally mean “unlimited” competition is sustainable. Telecommunications is so capital intensive that only a few viable contestants can sustain themselves, long term.

So fixed and mobile telecommunications are best thought of as oligopolistic, where only a few leading suppliers actually can exist in a market.

There are key implications. It likely never will be possible for more than a few facilities-based competitors to survive in any market.

That naturally will lead to thinking about regulatory policies based on robust wholesale obligations. The downside: robust wholesale tends to depress both investment by the existing carrier, and market entry by new carriers.

So the issue is not monopoly versus widespread market entry, but between monopoly and the best-possible (sustainable) level of competition among a limited number of contestants. That always will be a judgment call.

But that also poses issues for telecom regulators. If the regulated markets will, under the best of circumstances, only support a few suppliers, where is the boundary between oligopoly conditions where there is not enough competition, and oligopoly under which there is reasonable competition?

“High market concentration levels in a given market may raise some concern that the market is not competitive,” the Federal Communications Commision says. “However, an analysis of other factors, such as prices, non-price rivalry, and entry conditions, may find that a market with high concentration levels is competitive.”

In other words, says the FCC, even high levels of concentration do not necessarily mean a market is uncompetitive. Such markets might, in fact, be substantially competitive, even when other measures say they are not competitive.

We might not like the situation, but in some industries--including telecommunications--oligopoly is the pattern. There always are smaller niches within the market, but typically the amount of activity is a small fraction of total market revenues.

What is Happening to Revenue, Profit in the Access Business?

The state of the global telecommunications business, even the U.S. telecom market, or any of the industry segments, is hard to explain in a single number, or even a time series.

At one level, it is easy to point to continual growth. In fact, it would be hard to find a single year where aggregate revenue failed to grow, globally or in any single country.

But what that growth means for various providers, and different product segments, often is a different matter altogether.

                                         U.S. Telecommunications Revenue

The top line paints one picture.

From 2015 to 2020, U.S. wireline revenue will grow from $270 billion to $276 billion, at a compound annual growth rate of 0.4 percent, while U.S. mobile revenue will grow from $217 billion to $271 billion at a CAGR of 4.5 percent, according to Insight Research Corp.

Globally, communications revenue is projected to grow from $2.2 trillion to $2.4 trillion at a compounded annual growth rate of 2.3 percent from 2015 through 2020, Insight Research Corp. estimates.

The detail might tell a very different story.

In 2002, the U.S. telecommunications industry’s gross revenues were $385 billion (including cable and satellite TV), and its net revenues (after interconnection costs, program content, and handset subsidies) were $315 billion.

By 2013, even while consumer revenues grew, aggregate business segment revenues fell at least 15 percent.

And that understates the changes. Fixed network revenue fell by half. All the net revenue growth came from mobility or linear video services.

More significantly, where 85 percent of total Verizon earnings were driven by the fixed network, by 2013 the fixed network represented just 21 percent of earnings.


From 2015 to 2020, fixed network revenue will grow from $1.0 trillion to $1.1 trillion at a CAGR of 0.8 percent, while mobile revenue will grow from $1.1 trillion to $1.4 trillion at a CAGR of 3.5 percent.

Mobile revenues passed fixed network revenues a few years ago and by 2020 mobile revenue will be 25 percent higher than fixed revenue, according to Insight Research.

source: Global Telecommunications, International Telecommunications Union

source: Insight Research Corp.

source: Insight Research Corp.

The point is that gross revenue alone does not tell you what is happening with product demand or profitability.

International long distance, fixed voice, and now mobile voice and messaging, have suffered. High speed access, Ethernet access, cloud computing and mobile data have benefited.

Cable TV operators make more money, but many competitive providers make less, or are out of business.

New contestants, such as Google Fiber, Comcast and independent Internet service providers are demonstrating that facilities-based competition is more feasible than once believed.

So “total revenue” does not tell the story of what is happening “inside” the communications business, even at the level of access revenues, to say nothing of how application markets are changing.

AI Physical Interfaces Not as Important as Virtual

Microsoft’s dedicated AI key on some keyboards--which opens up access to Microsoft’s Copilot--now is joined by Logitech’s Signature AI mouse...