Monday, June 3, 2019

Get Ready for Continued Boosts in Average U.S. Internet Access Speeds

It always is dangerous to rely on slow or ponderous measurement mechanisms when any process is changing rapidly, as is the case for U.S. fixed network internet access. Historically, the United States has ranked about 15th globally on measures of voice service adoption or internet access adoption.


Rankings for internet access speed have often shown lower rankings than 15th, globally. Fastmetrics ranked the the United States about 20th for fixed network speeds about the middle of 2018.

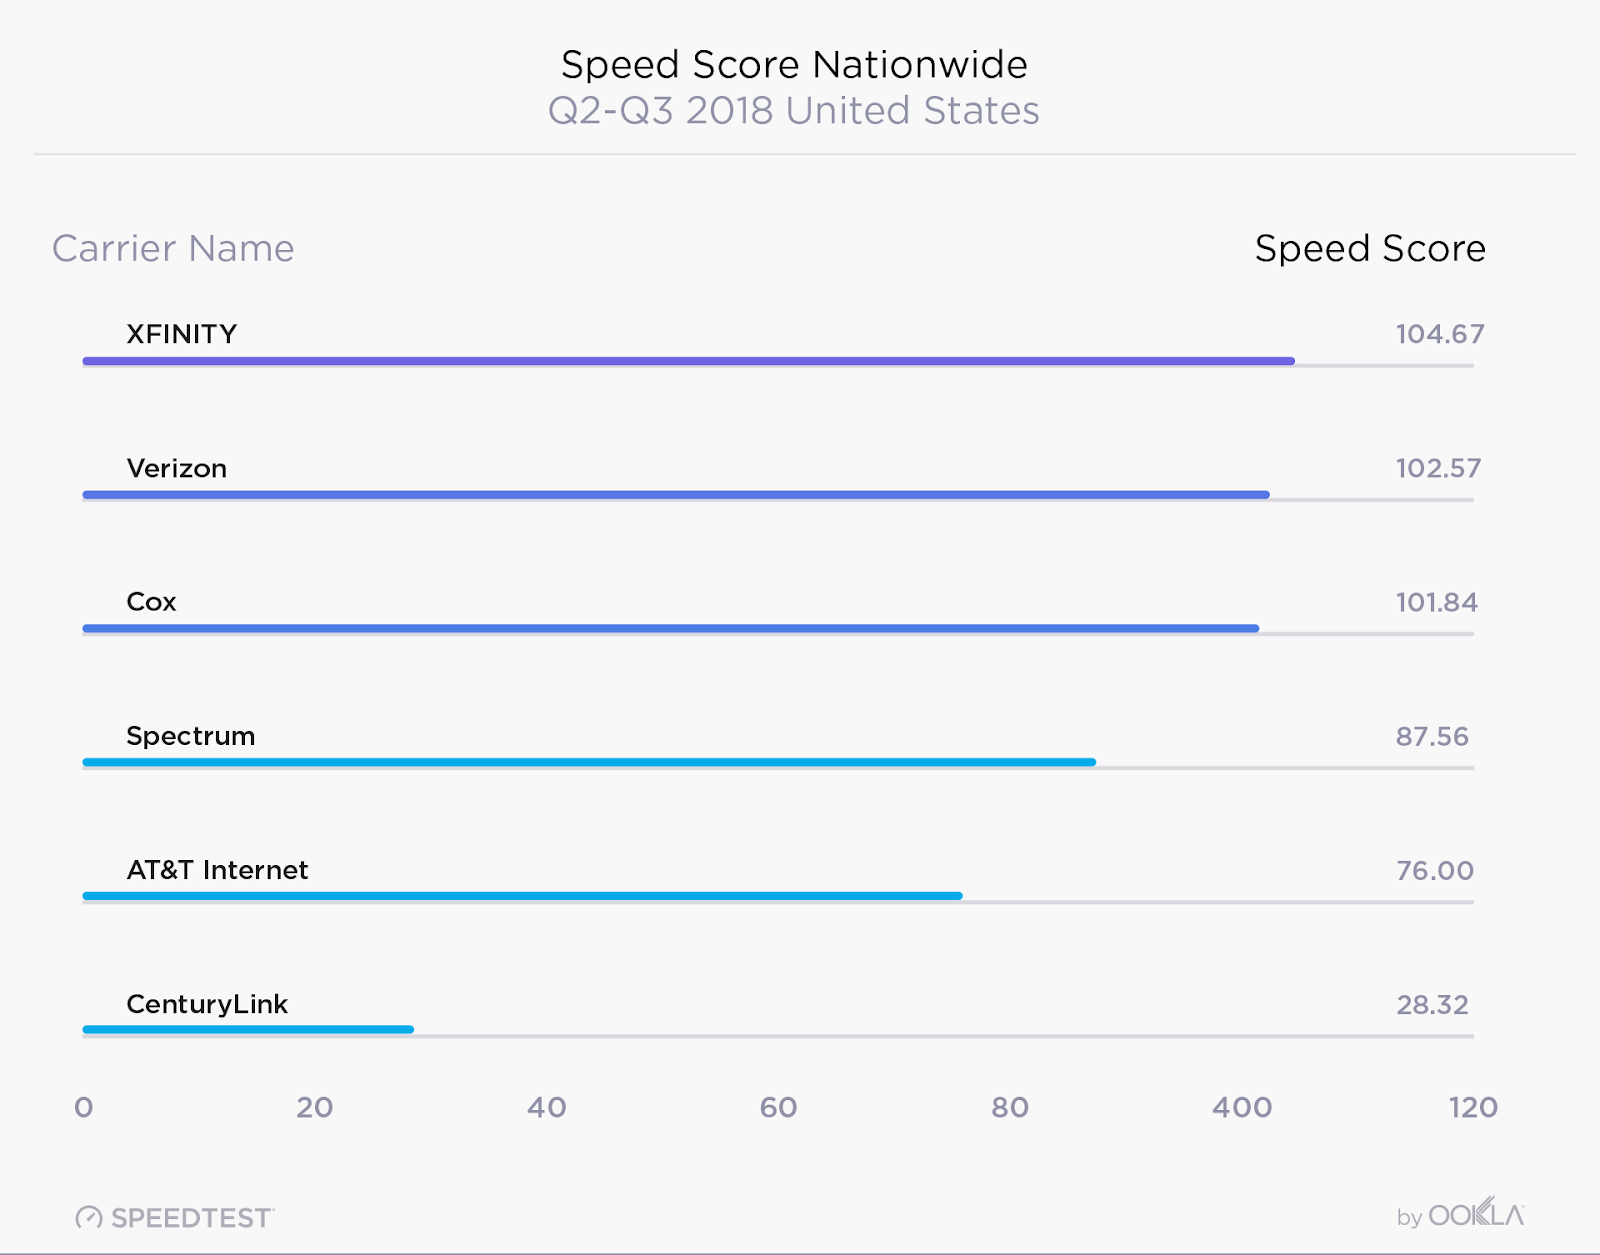
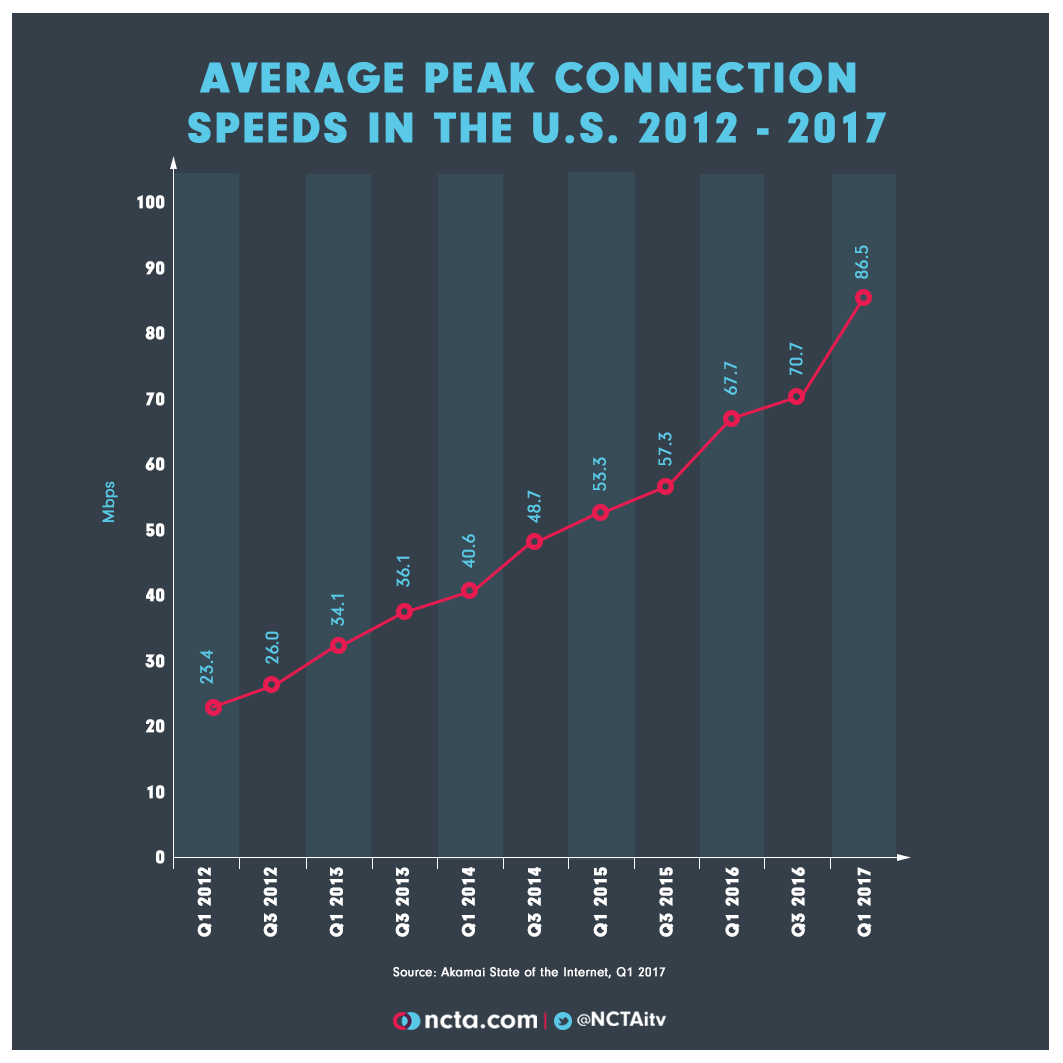
But speeds in the U.S. market are changing very rapidly, largely on the strength of cable TV fixed internet services. The latest Speedtest global comparison shows rapidly-increasing U.S. internet access speed, which improved about 36 percent in one year.

But 5G also will boost average mobile speeds significantly as well. Mobile speeds are one example, where the United States in 2019 ranked about 30th globally. All that is likely to change as 5G coverage spreads.

It is not just that 5G will provide an order of magnitude (higher in some cases) boost in speeds. On a comparative basis, the U.S. market is a first mover on 5G, so will reap the benefits while most other countries have not yet launched 5G.

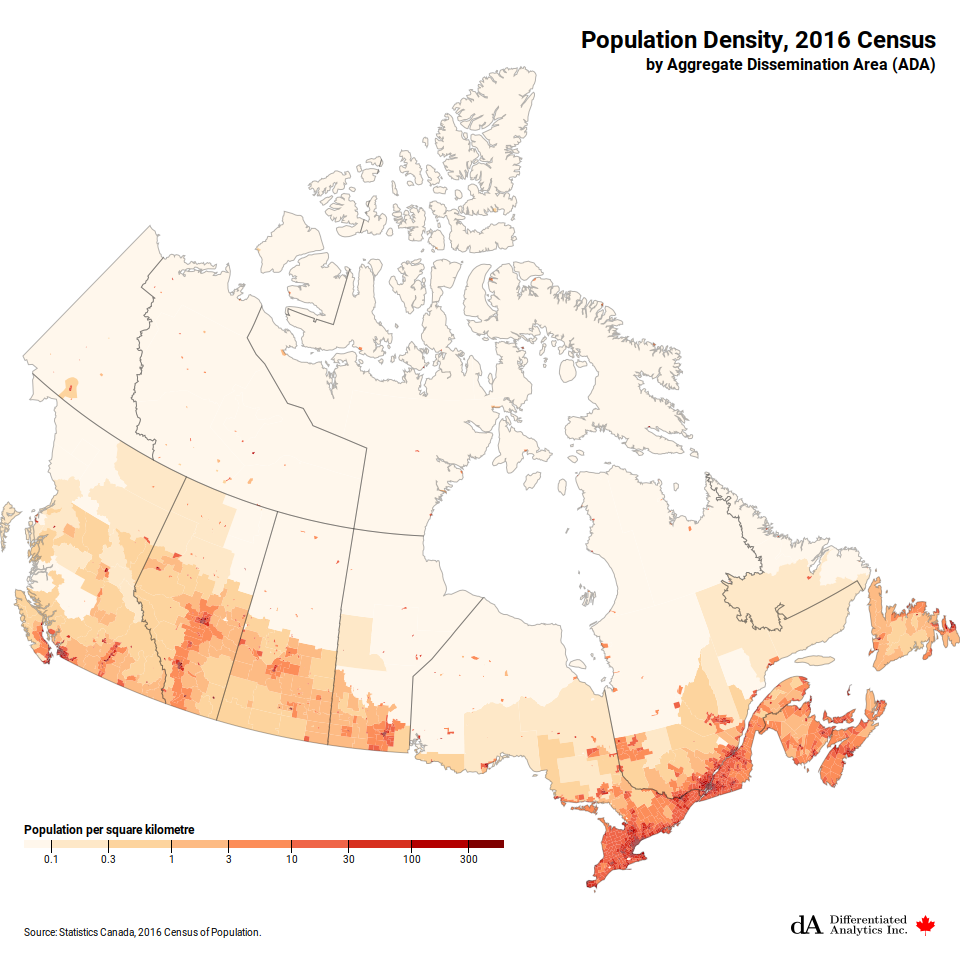
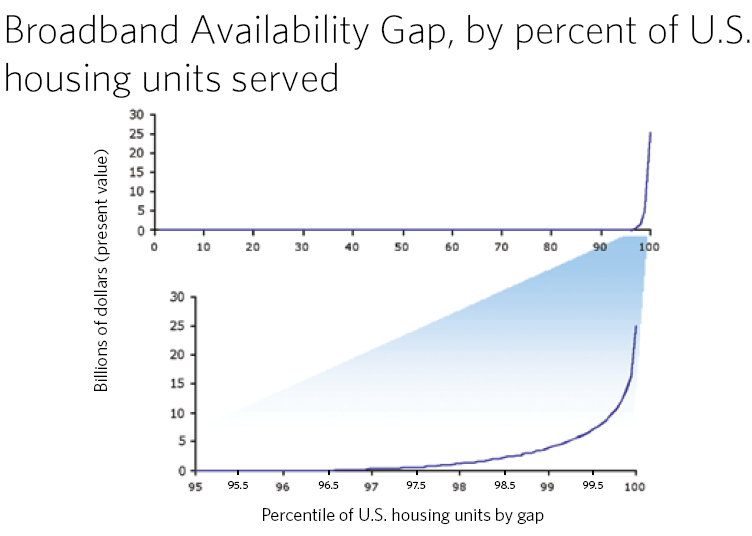
It seems always to be the last seven percent of households that lag average U.S. internet access speeds and availability.

If there are about 130 million U.S. housing locations, that implies the number of households not reached by cable networks is perhaps nine million locations.

Telco networks probably reach about 98 percent of housing locations. That does not mean seven percent of U.S. homes have no fixed network internet access, or that they have no ability to buy internet access.

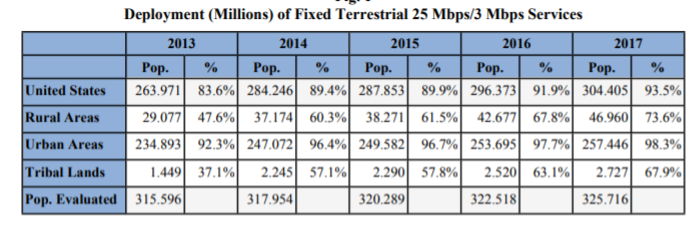
What those numbers mean is that, altogether, 93 percent of homes have access to 25 Mbps fixed network service (the minimum definition of “broadband”), with nearly 100 percent access to 25 Mbps or 30 Mbps by satellite.

Most of the homes that cannot buy a fixed network “broadband” service, using the current definition, can buy service at lower speeds. It always is the last couple of percent of homes in the most-isolated areas that have issues with coverage or speeds.


The issues with the last few percent of locations will remain. But there is every reason to predict a dramatic increase in typical U.S. internet access speeds as 5G is introduced, at least in part because fixed wireless will boost speeds, in part because mobile 5G will start to become more attractive as an alternative to fixed connections and because cable operators will continue to push speeds to stay ahead of those developments.

Channel Partners Sold 30% of Cloud Services in 2018

Channel partners generate about 30 percent of cloud infrastructure services spend, according to Canalys. If so, then distributors, resellers, service providers and systems integrators sold about US$24 billion globally in 2018.  

Canalys estimates the top three providers represented 65 percent (US$16 billion) of the channel’s total cloud infrastructure services business in 2018, with Microsoft currently the most important.

“Approximately 74 percent of revenue from Azure is estimated to come via its partners,” says Canalys.

The AWS channel business accounts for around 15 percent of sales. AWS has 35,000 partners.

Google Cloud’s channel business accounts for just over 25 percent of its US$7 billion cloud infrastructure revenue. Google has about 13,000 channel partners globally.


Sunday, June 2, 2019

Infrastructure Prices are Falling, for Good Reasons

Communications infrastructure costs are falling, for a number of reasons. Open source, virtualization and many new says of creating more bandwidth efficiently are among the reasons. Consider the cost of spectrum.

As much as some desire high spectrum prices (politicians who want to raise revenue, spectrum sellers who want to maintain high values for their assets, for example), low spectrum prices are good for service providers and consumers, as both benefit from lower costs.

The recently-concluded auction of 28 GHz spectrum produced low prices, compared to many other auctions over the past couple of decades.

And some will point to concrete reasons why that might have happened.  For starters, millimeter wave spectrum is more challenging in terms of signal propagation. Signals will not penetrate buildings and are obstructed by foliage and other obstructions, thus requiring more intensive engineering, use of smaller cells and therefore more backhaul. All that translates into higher costs to create commercially-useful connections.

Geographic coverage areas are smaller than in some past auctions, which again has implications for infrastructure to provide commercial service.

Also, the quantity of spectrum is vastly higher than in many prior mobile spectrum auctions. As always, more plentiful supply also means less scarcity, and less scarcity means lower prices. Consider two prior recent auctions, which featured 10-MHz blocks, where the 28-GHz auction reatured 425 MHz blocks.

Two orders of magnitude makes a difference.

Also, the 28-GHz auction was more oriented to rural areas, covering about 24 percent of the U.S. population and did not include counties located in most large metropolitan areas.

The prices paid for this 28 GHz spectrum were $0.011 per MHz-POP (megaHertz per potential user).  Compare that with prices paid for other recently-awarded spectrum:

Auction
Average Price (MHz-POP)
AWS-3 (Auction 97)
$2.71/MHz-POP
TV Broadcast Incentive Auction (Auction 1002)
$1.26/MHz-POP
28 GHz (Auction 101)
$0.011/MHz-POP


Some of us who simply point out that spectrum prices are falling for any number of good reasons, including a vast amount of new supply, ways of reusing spectrum (sharing and small cells), aggregating spectrum, aggregating licensed and unlicensed spectrum, as well as combining 4G and 5G spectrum from the same or different towers.

Some of us would say that lower spectrum prices are falling because effective supply now is eliminating scarcity. And scarcity is what causes high prices.

Saturday, June 1, 2019

Global Rankings of Broadband Coverage are Not So Accurate, or Useful

Without any question, the latest Federal Communications Commission report on U.S. broadband is going to be criticized, even if communications availability and use are problems we are solving, globally.


Among the frequent bits of evidence raised in support of the argument that “things are not getting better” are global rankings.


“How we measure” remains problematic. Comparing broadband adoption, availability, prices or speeds on a “per capita” basis only makes sense if household sizes are the same in all countries, which is not true.


To use an old but relevant example, the United States never ranked much higher than about 15th global for teledensity--the availability or purchase--of fixed network voice services, at peak adoption rates in 2000.


And yet nobody seriously argues the United States had a voice services availability problem. In 2007 the ranked about 15th globally for broadband adoption on a per-capita basis. The point is that very-large countries with large inhabited rural areas will always face more problems supplying ubiquitous communications by fixed networks, than small countries with high density.


Some will point to Canada as proof this is not true.


In Canada, perhaps 99 percent of people live on just about 20 percent of the land mass. In other words, the coverage requirements coverage requirements to reach perhaps 99-percent coverage require wiring about 20 percent of the land area. Some 80 percent of the land is virtually uninhabited.


Conversely, though there are sparsely-settled areas across much of the western interior, the United States has much more of its population living in rural areas, and quite a lot of the country has relatively low population density.


source: Reddit

Measurement issues also are very real: it does not make sense to compare the posted retail prices for products if they are not the products most consumers buy, in any country. Nor does it make sense to pick price comparisons that do not include common discounts (such as purchases in bundles).

Even if those sorts of issues are ameliorated, one has to adjust for purchasing power differences between countries.

Nor is it clear that prices have increased, in the United States or elsewhere. The problem is that general levels of inflation result in price increases for all manner of products, over time. That is why we inflation-adjust prices when making comparisons over time.

Also, volume makes a difference. People might spend more money on fresh vegetables, over time, if they decide to eat more fresh vegetables. Prices can drop, but volume purchased can grow. And people are using more data.

Around 1995, the cost of buying a U.S. business connection supporting a kilobit per second might have been US$1.50 to $1.75. In other words, a 56 kbps connection might have cost as much as $98 a month.

By about 2006, even consumer internet access costs had dropped to about two cents per kbps. So a 10 Mbps connection might then have cost the same as the 56 kbps connection of 1995. In 2017, U.S. 100 Mbps connections cost about the same as a 56 kbps connection of 1995.

The point is that ranking countries on measures of broadband adoption or coverage can be quite misleading. That the United States ranks only about 15th globally for broadband adoption just does not mean very much. 

Will Global Fixed Network Broadband Reach Near Saturation by 2022?

By the end of 2025 there will be 1.2 billion fixed broadband subscribers worldwide, according to Point Topic. Between 2018 and 2025, fixed broadband subscription in the top 30 markets will grow by 22 percent. Global take-up, including rest of the world, is expected to grow by 24 percent.

But Point Topic also suggests that growth will flatten at about that level, globally. And mobile substitution using 5G networks is among the probable reasons for the slower growth.

“The slowdown in growth and, in some markets, possible decline in fixed broadband subscribers will be impacted by the launch of superfast 5G services,” says PointTopic. “We predict that the impact will be especially noticeable in more saturated fixed broadband markets.”

Much will hinge on tariffs, especially usage allowances and the pricing of 5G data consumption close to that of fixed networks. Mobile data prices, on a cost-per-gigabyte basis, often are 20 times to 60 times more costly than fixed network prices.

But mobile substitution will contribute to slower growth of fixed broadband accounts in many advanced economies, according to Point Topic.


Other forecasts also suggest slow growth of fixed connections through 2022. Also, significant growth rates occur from a really-low base (almost zero) in 2000, reaching perhaps one billion accounts in 2017.  

Thursday, May 30, 2019

U.S. Internet Access Speeds are Improving Fast

Without any question, the latest Federal Communications Commission report on U.S. broadband is going to be criticized. The data overstates deployment, it will be argued. Some might argue 25 Mbps is not broadband. The thrust of the complaints will be that the U.S. digital divide is either not closing or not closing fast enough. Some conceivably will argue the divide is getting worse.

But coverage and speeds are growing. Sure, there is a gap between rural and urban. There likely always will be some gap. But the gaps are closing.


All methodological shortcomings noted, it is hard to argue that the U.S. speeds are too low, or getting worse. There really is not any evidence for that view. In 2018 alone, U.S. average internet access speed  on fixed networks grew 36 percent, according to Ookla Speedtest.

In 2019, U.S. fixed internet service provider were 96 Mbps downstream, according to Speedtest. Even mobile average speeds were in the 33 Mbps range in 2018.


Why Big Public Spending Projects Often Produce No Significant Economic Benefit

Big public investments including sports stadiums and government-owned broadband often are controversial because the claimed benefits (new economic activity, especially) cannot actually  be shown to exist.

In the case of public funding for sports stadiums, the purported new economic activity is simply shifted from other expenditures in the same community, with no actual net increase in economic activity.

“NFL stadiums do not generate significant local economic growth, and the incremental tax revenue is not sufficient to cover any significant financial contribution by the city,” said Roger Noll, a senior fellow at the Stanford Institute for Economic Policy Research.

“A new sports facility has an extremely small (perhaps even negative) effect on overall economic activity and employment,” an analysis  by the Brookings Institution has found.

In a 2017 poll, 83 percent of the economists surveyed agreed that "providing state and local subsidies to build stadiums for professional sports teams is likely to cost the relevant taxpayers more than any local economic benefits that are generated."

Sports economist Michael Leeds suggests that professional sports have very little economic impact, noting that a baseball team (with 81 regular-season home games per year) "has about the same impact on a community as a midsize department store." Doubtless that small an impact would normally be thought unreasonable for the large amount of public cost.

Leeds suggests that if every professional sports team in Chicago (Cubs, White Sox, Bears, Bulls, and Blackhawks) were to suddenly disappear, the economic impact on Chicago would be a fraction of one percent.

Moreover, most economists highlight an important pitfall when politicians or stadium funding advocates tout the economic impact of stadiums: the failure to include opportunity costs.

The opportunity cost is the value of the next-best alternative when a decision is made; it is what is given up, whether that is in roads, bridges, schools, parks, riverfront improvements or anything else with expected positive economic impact.

Also ignored is the fact that what is spent by consumers at stadiums, and for stadiums, simply displaces spending that would have occurred elsewhere.

If they were not spending on sporting events, they would instead spend on museums, movies, concerts, theater, restaurants, and so on. Because consumers have limited entertainment budgets, dollars spent at a new stadium are simply diverted from other spending.

That might also be true for government-owned broadband networks that compete with private broadband suppliers.

In a new study, The Rewards of Municipal Broadband: An Econometric Analysis of the Labor Market, Phoenix Center Chief Economist Dr. George Ford and Phoenix Center Adjunct Fellow Professor R. Alan Seals (Auburn University) use data obtained from the U.S. Census Bureau’s American Community Survey to quantify the economic impact, if any, of the county-wide government-owned network (GON) in Chattanooga, Tenn. on labor market outcomes.

“Across a variety of empirical models, we find no payoffs in the labor market from the city’s broadband investments,” they conclude. “We find almost no statistically significant effects for a wide range of important labor market variables, with the possible exception of a reduction in labor force participation.”

The study looked at private-sector labor force participation, employment status, wages, information technology employment, self-employment, and business income, “all of which appear unaffected by the GON,” the researchers say.

Though Chattanooga’s Mayor Andy Berke has claimed that the city’s nearly $400-million network was responsible for a decline in unemployment in the city from 7.8 percent to 4.1 percent over the 2012 to 2015 period, over the same post-recession period the nationwide unemployment rate fell from 7.5 percent to 4.7 percent, they note. So it is hard to isolate any impact other than general economic conditions for the decrease.

There are some key caveats. A new Volkswagen factory, planned before the GON was launched, did open at about the same time as the network began operations. “Marginal employment effects in auto manufacturing closely match the plant’s employment levels,” the researchers note.

Also, since Chattanooga’s system is an overbuild of multiple private providers, “we stress that our findings may not be generalized to areas where broadband services are not available absent the municipal system,” Ford and Seals say.

“Also, our results cannot speak to the benefits of high-speed Internet services generally, since broadband Internet service was and remains available in Chattanooga absent the municipal system,” they say. “Thus, our results indicate only that building a government-owned network in markets where privately provisioned broadband is generally available has no favorable effect on labor market outcomes.”

“The data suggest local governments must look outside the labor market to justify the sizable investments in municipal broadband systems,” the authors say.

Will Video Content Industry Survive AI?

Virtually nobody in business ever wants to say that an industry or firm transition from an older business model to a newer model is doomed t...