Wednesday, June 9, 2021

How Big a Revenue Opportunity for Network Slicing?

As you might expect, telecom infrastructure firms are big believers in the potential for new services such as network slicing. Ericsson, citing Arthur D. Little estimates, has said service provider network slicing revenue upside of as much as $200 billion by 2030. 


Others suspect connectivity revenue will be quite a bit smaller, as little as less than $1 billion in annual revenues by about 2026. The other issue is that the “market” includes both sales of infrastructure to create the service provider capability, and the value of services sold by connectivity providers to customers. 


The infrastructure portion of the market is far larger than the connectivity services segment. Also, we may quibble about what constitutes “network slicing” investments, since that capability is a feature of the 5G core network. 


We might reasonably discount such figures, as those figures represent “potential” opportunities. The only issue is how large a discount is warranted.


Some of us might discount as much as 90 percent of the forecasted revenues, as it is likely mobile service providers will not, in the end, be able to become leading suppliers of most of the ecosystem value or revenue. That suggests a figure more like $20 billion by 2030. 

source: Ericsson 


Healthcare represents 21 percent of service provider addressable revenues; government 17 percent, transportation 15 percent; energy and utilities 14 percent; manufacturing 12 percent and media and entertainment 11 percent. 


Ericsson sees a $23 billion opportunity for connectivity providers, if service providers act as network developers or service creators. As a service creator the CSP would engage in activities like reselling devices, application platform provisioning, data monetization or offering support. 


The network developer role includes the supply of connectivity services and bandwidth.  

The role as service creator in automotive offers a significantly higher revenue

source: Ericsson


Healthcare represents a $6 billion opportunity for service providers in 2025 and could grow to $23 billion in 2030. 


In the energy segment, typical customers include small and medium-sized energy companies and power plants. By 2030, slicing-enabled revenue is expected to approach $46 billion and the addressable revenue for service providers will approach $20 billion.


Monday, June 7, 2021

Do Some Electrical Utilities Cross Subsidize Home Broadband, and Do Such Subsidies Increase Electricity Rates?

Cross subsidization of competitive lines of business by common carrier operations is a matter of decades-long interest with respect to home broadband services. It was an issue in the monopoly era of telecom as well, the concern being that lines of business outside the common carrier core not be subsidized. 


Over the past two decades, the issue also has been raised with respect to common carrier electrical utilities diversifying into home broadband services. 


In a detailed financial analysis of the utility-funded broadband network in Opelika, Alabama (which was recently sold after years of heavy losses), Phoenix Center Chief Economist George S. Ford found direct evidence of rate increases for the city’s electric customers to cover the broadband network debt payments.


In other words, there was clear evidence of cross subsidization.  In that city, electricity rates were increased by an average rate of $5.39 to cover a $0.8 million revenue shortfall, an amount well short of the $1.4 million in annual debt service for the broadband network placed on the electric utility’s books, Ford notes. 


Two of the nation’s largest utility-owned broadband networks are operated in the Tennessee cities of Chattanooga and Clarksville. The two cities also are ideally suited to an analysis of the electricity rate effects of a GON since both cities loaded most of the debt of the broadband network on the city’s electric utility, says Ford. 


There is strong evidence of significant electricity rate increases in cities using the utility-funded model. The average monthly increase of nearly $12 for residential and commercial users translates into millions of dollars of cross-subsidy from captive electric rate payers to the broadband networks, says Ford. 


No electricity rate increases are found for GONs funded through general obligation bonds.


How Big--or Small--Is Service Provider Network Slicing Market?

Among possible new revenue sources created by 5G, network slicing is expected to support advanced connectivity use cases for enterprises and governments that are primarily, though not exclusively, driven by untethered end points. 


Most observers now believe 5G revenue growth will be disproportionately driven by new use cases and value for enterprise, business and government. 


In large part, that is because businesses are expected to be the buyers of edge computing, network slicing and internet of things sensor applications. 


That noted, consumer revenues in Europe, for example, are stable at about 68 percent of total revenue (mobile and fixed). In some markets, business revenues could range from 30 percent to 40 percent of total. Smaller providers might generate only about 15 percent of total revenue from business segments. 


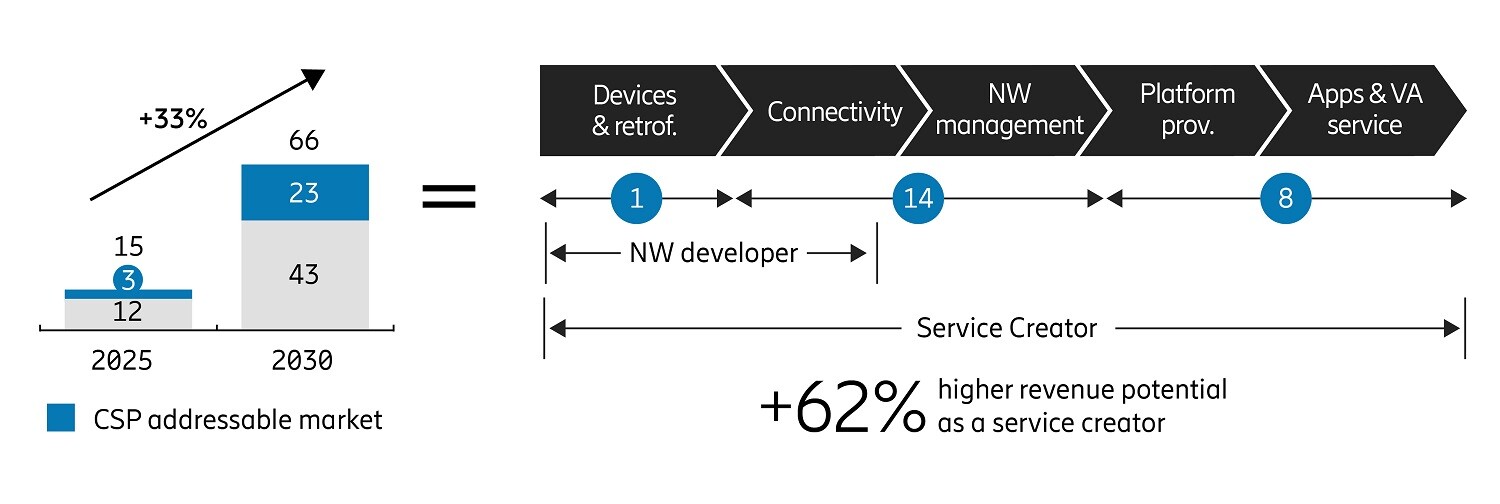
The issue is how much additional 5G revenue lift might be possible, from network slicing, for example. Some believe the connectivity portion of the market is fairly small, despite the hype. 


How small? Less than $1 billion globally by 2026. That is hardly a “market” at all, by global telecom standards. That noted, value sometimes is monetized in other ways, such as higher new account rates, lower churn, higher gross revenue, lower capex, lower opex or some combination of those benefits. 


source: GM Insights 


A network slice is a virtual network created through a 5G core network able to maintain private network features all the way to the end point. In principle, a network slice should be easier and faster to create and tear down, with advantages for temporary networks or use cases including disaster recovery, large events or other instances where unexpected--but temporary--demand emerges.  
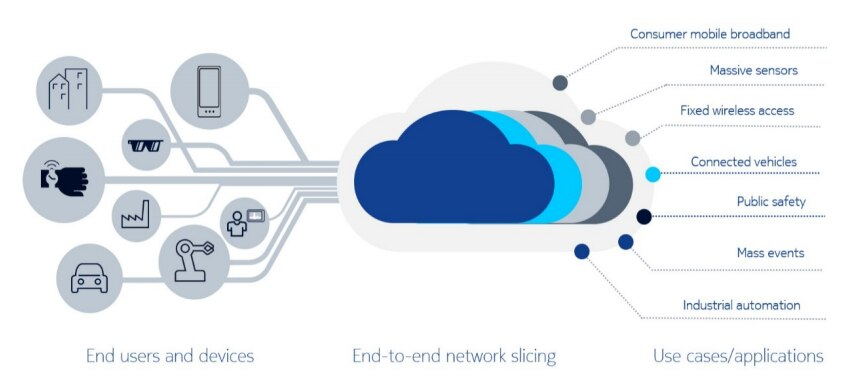

 source: Nokia


Mobile gaming is one consumer use case while internet of things applications are the best examples of enterprise or government use cases.


Network slicing allows creation of virtual networks whose characteristics (bandwidth, speed, latency, reliability, and security) can be optimized. Network slicing offers a way to create virtual networks with performance characteristics optimized for lead applications. 


Mobile gaming using virtual reality or artificial reality might benefit from latency and bandwidth assurances. Other use cases in the financial industry might benefit from enhanced security and network availability guarantees. 


In the fleet management industry, different core functions might benefit from use of distinct network slices. Low latency and ultra-reliable performance might be best for  traffic notification, where infotainment requires higher bandwidth but less need for low latency or robustness. 


It is conceivable network slicing protects core transport bandwidth for fixed wireless operations, since fixed wireless peak bandwidth usage might be an order of magnitude higher than typical mobile data requirements. 


Quality of service also has been a driver of product pricing differentiation. Business services with QoS guarantees, support services reaction times and financial advantages for customers if the policies are violated, have been a staple of communications product pricing for decades. 


The ability to support 5G network slicing in the core network, all the way to the mobile edge, is supposed to create new product capabilities, such as networks optimized for particular parameters. 


Ultra-low latency performance; bandwidth guarantees, security or performance predictability will be touted as values of network slicing, a new way of creating virtual private networks. 


Network slicing value for retail customers, though, will have to be proven. One might argue that edge computing is a functional substitute for many network slicing use cases, for example. 


It would be fair to note that connectivity providers often have developed and offered  many features and services they  believed customers would want. The catch is that revenue for connectivity providers is the cost for enterprises, businesses and consumers who are asked to buy and use the features and services. 


If ultra-low-latency applications are those which could benefit from network slices, one alternative is to do commuting at the edge, and not sending data across wide area networks that are optimized for low latency. In other words, edge computing might often be a functional substitute for network slicing.  


In many use cases, the value of ultra-low-latency computing is supplied by edge computing services, with non-real time backup across wide area networks. 


Perhaps ironically, consumer customers who have few other alternatives might be good candidates for internet access with quality of service features a network slice offered by a connectivity provider, providing governments deem this lawful. Network neutrality rules often var the offering of consumer services with quality of service guarantees, for example. 


Gaming services, work-from-home conferencing and ultra-high-definition video are among potential consumer use cases for network slicing, where lawful.


Sunday, June 6, 2021

How Much Share Can Telcos Claim as They Step Up FTTH Investments?

U.S. cable operators have taken market share in consumer broadband for most of the last two decades. But some analysts believe a new wave of investment in fiber to home facilities will allow telcos to claw back significant amounts of installed base. 


Long term, MoffettNathanson sees cable having a 50 percent broadband market share in markets in which they compete with fiber-to-home facilities. That implies a shift of 20 percent of the installed base from current levels. 


Not all observers agree with that analysis. S&P Global Market Intelligence, for example, does not expect stepped-up telco FTTH investment to change share statistics very much. 


But S&P Global Market Intelligence does believe new competition from mobility suppliers using fixed wireless (T-Mobile, for example) will gain about six percent share of the aU.S. residential broadband market with about 7.19 million subscribers. 


It is not yet clear how much of that share gain will be claimed by upstarts in the home broadband market such as T-Mobile, and how much will be gotten by fixed wireless operations conducted by incumbents such as AT&T and Verizon. 


The former gains will represent market share gains by telcos, but perhaps some losses for AT&T and Verizon. The latter could increase the installed base held by AT&T and Verizon. 


Also, some of that share will be gained by independent wireless internet service providers. 


S&P Global Market Intelligence also estimates there will be about 1.52 million satellite customers by the end of 2021, accounting for just one percent of the installed base of home broadband accounts. 


Today, cable operators get as much as 85 percent market share when facing telcos using VDSL and 95 percent market share competing against telco DSL facilities, the firm says. Where cable companies compete against telco FTTH, the big telcos have gotten somewhere in the range of 40 percent or slightly-higher share of the installed base. Some smaller telcos manage to get 50 percent of the installed base.  


In the first quarter of 2021, the largest U.S. telcos had about 31 percent share of the installed base and got about eight percent market share of net new accounts, according to Leichtman Research. 


Mobile market share gains could also be an issue. T-Mobile, for example, expects to gain home broadband share, especially in rural areas, at the same time it gains mobile account share. 


Some 15 percent of U.S. adults are mobile only for home broadband, says Pew Research.  The point is that telco FTTH competes against cable, other mobile companies, independent ISPs and satellite. 


And stranded assets and financial return remain issues for telcos investing in new FTTH facilities. As voice and video entertainment revenue streams have dwindled, the business case for home broadband using FTTH increasingly relies on internet access as the main revenue driver for the FTTH business case. 


That is why some see fixed wireless as important. It might be the only way for telcos to compete against cable and other competitors in many geographies. 


Always a difficult business decision, the economics arguably have become worse as voice and entertainment revenues dwindle, increasingly making FTTH viable in some urban or suburban locations, not all. Rural deployments rely on subsidies. 


Rural customers represent about 40 percent of the entire mobile services marketplace, including 54 million households and about 140 million people, according to T-Mobile. Historically, T-Mobile has been underrepresented in rural markets, compared to AT&T and Verizon.


Saturday, June 5, 2021

U.S. Gigabit Home Broadband Nears Inflection Point

About 9.6 percent of U.S. home broadband accounts now buy service at 1 Gbps, says Openvault. That is important because, historically, successful consumer products hit an adoption inflection point at about 10 percent adoption rates. In the colloquial, what happens is that “you buy because your neighbor has it.”


source: Openvault 


To the extent that gigabit internet access can be considered a discrete product, a shift in buying to gigabit speeds by a growing percentage of customers also will shift the rest of the market toward higher speeds. 


The inflection point around 10 percent adoption fits with the classic “S curve” of business or product evolution as well. 


source 


It is worth noting that not every innovation succeeds. Perhaps most innovations and products aimed at consumers fail, in which case there is no S curve, only a decline curve. 


source: Thoughtworks 


The consumer product adoption curve and the S curve also are related to the point at which early adopters are buyers, but before the mass market adoption starts. 


source: Advisor Perspectives

Thursday, June 3, 2021

SMBs Boost Managed Service, Cloud Services Use During Pandemic

To nobody's present surprise, small and mid-sized businesses in the United States, United Kingdom, Canada and Australia made significant moves to adopt cloud-based remote work technology and managed services during the Covid-19 pandemic, Analysys Mason says. Many survey respondents suggest they will continue to use those new managed services once the pandemic is over, in large part because many expected higher levels of work from home on a permanent basis.


source: Analysys Mason 


Use of new collaboration solutions is the notable feature of SMB response, though new users of cloud technology of various types or managed services also seemed to grow up to 10 percent. 

source: Analysys Mason 


At least in the first quarter of 2021, most respondents expected they would continue using those new managed services after the pandemic ends, in large part because a greater volume of work from home is expected, compared to pre-pandemic levels. 


source: Analysys Mason


Analysys Mason surveyed 1870 small and medium-sized businesses (SMBs) in Australia, Canada, the UK and the USA between December 2020 and February 2021, about their business and technology responses to the Covid-19 pandemic.


As you would expect, given widespread economic lockdowns, revenue declined for 55 percent of “small” businesses (up to 99 employees) and 38 percent of mid-sized businesses (100 to 999 employees).


The finance, insurance and real estate industries; healthcare and professional services sectors fared best in terms of revenue “normalcy.” Firms in retail; wholesale; other business services and hospitality reported the most significant losses, Analysys Mason says. 

source: Analysys Mason 


Wednesday, June 2, 2021

Global Bandwidth Demand Generated by a Relative Handful of Data Centers

Some might recall a time when international capacity existed mostly to transport voice calls. In 1980, for example, tier-one telcos were the owners of the transmission assets and trans-Atlantic capacity could easily be measured in kilobits per second up to 1.5 megabits per second. 


These days, capacity on global routes is measured in terabytes. In 1980, most of the demand was generated by people making long distance calls. Today, internet apps and video drive most of the global demand for capacity.


source: AI Trends 


A small handful of firms--Google, Facebook, Amazon, and Microsoft—drive most of the demand for international capacity. In 2020, those four firms accounted for 66 percent of all used international capacity. So content services and applications now drive demand for global bandwidth.


About 45 percent of such hyperscale data centers are located in the United States, about eight percent in China, seven percent in Japan, for example. 

source: Synergy Research


Beyond that, the owners of facilities are mostly a handful of content and application providers, not telcos or connectivity service providers. 


Annual demand still grows close to 50 percent, especially on routes connecting Africa and Asia. On other routes, annual growth ranges between 30 percent and 40 percent, according to Telegeography. 


source: Telegeography 


One might think most of that capacity is used to deliver content and data to end users of the internet. Actually, most of the bandwidth connects hyperscale data centers operated by the largest app firms. 


source: Vox.com, Cisco 


source: Cisco 


Among many other changes to the global telecom business caused by a shift to internet, mobile and cloud communications, global bandwidth patterns have changed. In the past, long haul traffic originated and terminated at central offices. 


Now, with the dominance of mobile-consumed content and apps, using the internet, cloud computing and web browsers or apps, traffic originates and terminates heavily at hyperscale data centers.


source: Cisco


Asia-Pacific has been the fastest growing region in terms of hyperscale data center location and will continue to grow more rapidly over the next five years, although North America accounted for 43 percent of hyperscale data centers in 2020, says Cisco.


The point is that global capacity demand has shifted dramatically: from telcos to app and content providers; from voice to internet traffic; from voice to video; from end users to data center interconnection.


Where, and How Much, Might Generative AI Displace Search?

Some observers point out that generative artificial intelligence poses some risk for operators of search engines, as both search and GenAI s...