Sunday, September 12, 2021

Danger to Profits, Operating Costs and Manual Processes Seem Top of Mind for Enterprise Execs: DX Concern is Really Not CX

Even allowing for a substantial measure of “this is what I am supposed to say,” enterprise executives rank the danger to profits and operating costs by 2023 as much more important issues than threats to customer experience, which is among the least likely to suffer from disruption in the near future. 


source: McKinsey 


What stands out in a recent McKinsey survey of 1140 senior enterprise managers is the concern that existing products and revenue models could be endangered and that new digital products must be created. 


source: McKinsey 


Even when some equate “digital transformation” with “customer experience,” that does not seem to be the way most enterprise profit center managers, C titles or directors seem to see matters. As always, the ability to generate profit at desired levels tops all other concerns, with operating costs also top of mind as that affects profits.


Saturday, September 11, 2021

One Way a Return to the Office Might Decrease Team Spirit

A study of 9,000 U.S. workers by ADP Research Institute finds some unexpected--and many expected--employee attitudes about remote work. 


“Social connection, promotion opportunities and work-life boundaries are the most-cited benefits of on-site work,” according to employees. You might expect that. 


Perhaps unexpectedly, employees believe a return to the office will lessen--not increase--team spirit. Credit gossip, cliques and other forms of social behavior for this belief. 


As you might expect, in-the-offce work leads to more  organic communication. Some 77 percent of on-site workers say they engage in spontaneous conversations with their teammates during the work week. Only 60 percent of remote workers say that happens. 


On-site workers report a shorter workday--on average, one hour less--than remote workers. Those working remotely are more likely to say they have longer days post-Covid (39 percent) compared to on-site workers (21 percent). 


Fully 57 percent of employee think that their managers prefer on-site employees over remote workers. And 50 percent of managers themselves say that they actually do prefer on-site employees when making decisions on hiring and promotions. 


source: World Economic Forum 


Nearly half of employees say that “productive” (44 percent) and “undistracted” (48 percent) are more likely to be traits describing on-site workers and not remote workers. 


About 33 percent of those surveyed believe it makes no difference to productivity or distraction whether someone is remote or on site. 


Remote workers are more likely to say that communication with their manager (or with direct reports if they are a manager) has deteriorated (26 percent). In contrast, just 14 percent of on-site workers whose boss also works on-site say communication has decreased.


Friday, September 10, 2021

What Changes for Enterprise Spending After Covid?

As someone who believed Covid would end sooner than it has, and would not have as much long-lasting impact on enterprise work practices, there is some new evidence suggestive of long-term changes. The issue is that the changes pull in different directions. 


To be sure, as the pandemic is not yet “over,” it might not be possible to assess the magnitude of potential shifts for some time. Still, there is some evidence that external collaboration impact might be the opposite of internal collaboration impact. 


Also, face-to-face meetings might be more important for some roles--such as sales--than for customer support, training and marketing. Meeting clients is seen as the top reason to resume travel, according to a Deloitte survey, while internal meetings and training are more likely to stay online.


U.S. spending on business travel is expected to only reach 25 percent to 35 percent of 2019 levels by the fourth quarter of 2021, and 65 percent to 80 percent a year later, according to a Deloitte survey of 150 travel managers.


To the extent that more remote work is going to be a permanent change, it is worth noting that collaboration and productivity trends might not be as rosy as many self-reports suggest. 


A study by researchers of Microsoft employees shows firm-wide remote work caused the collaboration network of workers to become more static and siloed, with fewer bridges between disparate parts. Furthermore, there was a decrease in synchronous communication and an increase in asynchronous communication.


Company-wide remote work caused business groups within Microsoft to become less interconnected, the researchers say. 


Remote work also reduced informal collaboration. Furthermore, the shift to firm-wide remote work caused employees to spend a greater share of their collaboration time with their stronger ties, which are better suited to information transfer, and a smaller share of their time with weak ties, which are more likely to provide access to new information, the study suggests. 


The researchers  suggest that hybrid and mixed-mode work arrangements may not work as firms expect. 


To be sure, long-term effects might not be the same as the short-term effects. the period of time over which we measured the causal effects of remote work are quite short (three months), and it is possible that the long-term effects of firm-wide remote work are different. 


For example, at the beginning of the pandemic, workers were able to leverage existing network connections, many of which were built in person. This may not be possible if firm-wide remote work were implemented long-term.


In other words, social capital decays over time. 


The point is that we might see several trends that run counter to each other, with new “distributed and remote” work modes producing less face-to-face interaction, while sales activities might need to be reinstated for sales operations. 


On the other hand, many enterprises also will find less need for face-to-face support for some internal operations and some customer-facing tasks. 


On a broader level, we might look at an analogy to changes wrought by widespread use of the internet and mobility.  Every content business you can think of was changed, first by the internet and then by mobility. 


To the extent that the internet reduced information gaps or friction, demand for trade shows, magazines and newspapers actually fell. Much the same has happened with mobile-based communication and media. Newspaper revenues fell while online revenue grew. 


Home video shifted to online. Linear subscriptions shifted to internet-based subscriptions. Music likewise shifted from physical media to internet delivery.


In the business world, software distribution also shifted from physical media to online fulfillment; products to services. With quality broadband nearly ubiquitous, computing shifted from local to remote, as well.   


To the extent that trade shows, trade journals and specialized business publications were needed to reduce information friction, there simply was less need once the internet made information more transparent and easy to get. 


There may be parallels with the ways business information and commerce changes after Covid. Demand for some activities will decline while others replace them. Business travel, trade shows and collaboration itself might be altered on a permanent basis.


Cincinnati Bell Goes Private

Cincinnati Bell is among the latest to go private, as the firm has been acquired by Macquarie Infrastructure Partners. Iliad in France wants to do so and Altice Europe did so earlier in 2021.


Among the key drivers for those privatizations is the perception by asset owners that public markets will not positively reward the firms, in terms of equity valuations, commensurate with their revenues, cash flow or potential growth prospects.


Another key driver is private equity firms with lots of private capital to invest, and assets that offer long-term and predictable cash flows.


That, in turn, is matched by desire to invest by pension funds and other entities with long time horizons that view infrastructure assets as equivalents to other long-duration fixed-income assets such as bonds.


Also, asset diversification is another motivation for investors.


There is a good reason why any number of public telecom firms have been taken private, and why others are considering similar moves: high debt, low growth and poor operational performance. And connectivity providers are not the only type of firms facing investment issues.  


That is a fairly-common prescription for any public company to be taken out of the public markets by private equity, and many public telco assets  fit the bill. 

source: Focus Finance


One defining characteristic of infrastructure assets is their monopolistic position. We tend to forget that for most of the history of the industrialized world, much of the funding for large scale public infrastructure such as roads, canals and railroads has come from private sources of capital. And that includes telecommunications in the United States. 


source: Maria Sward 

The function of private equity also has included the rehabilitation of firms that are not performing financially. Private equity buys a public asset, restructures and then sells the asset, often within about a five-year period. 

source: Bain


Thursday, September 9, 2021

Agility Prepares Organzations for 3 of 4 Types of Business Risk

All knowledge can be categorized in four boxes, since the time of the Greek philosophers, many argue. The same process is used by some analysts of risk and implicitly guides everyday business behavior. 


Whether something is known or unknown makes a difference for risk mitigation or management, and also provides a key rationale for developing greater organizational agility. But that requires work and commitment, as a rational executive is going to focus most of his or her time on dealing with “known known” types of risk. 


The cost-benefit of preparing for other types of risk is so low that most will spend relatively little time on them, with the possible exception of “known unknowns,” where research might plausibly convert an unknown to a known. 


A known known can be statistically modeled and behavior based on statistical odds of occurrence. 


Processes we understand we know can be statistically modeled. We can make assumptions about likelihood. We can set insurance rates, for example, or devise plans to take market share from a specific competitor. 


When there are processes we know about, but cannot predict, we conduct research to try and eliminate the uncertainty.


“Unknown knowns” involve processes we know exist, but do not deem relevant to us. There is little or no perceived risk, so organizations do not plan for or worry about such matters, as the risk is deemed so rare. 


“Unknown unknowns” are quite dangerous, as nobody recognizes there is any danger. When “one does not know what one does not know,” any rational search for answers will be thwarted.  


Unknown unknown vs. known unknown chart

source: Veritas 


A known unknown cannot be accurately modeled, so an organization has to aim for agility, the ability to shift and change if and when the magnitude of an event is large. 


It is impossible to plan, in practical terms,  for an unknown unknown. These are the sorts of catastrophic changes which can imperil an organization’s existence. 


Unknown knowns pose risk because an organization might be aware of the risk, but deem it so unlikely that nothing is done to prepare for such events. 


The point is that organizational agility is a major capability for dealing with three of the four categories of risks: known unknowns; unknown knowns or unknown unknowns. 


source: UX Collective 


“Known knowns” are things we know that we know and understand. Presumably, risk is low as we understand something. 


“Known unknowns” are things we realize that we don’t know or understand. Or perhaps a better way of describing this category is that there are matters we know, but are unclear about potential risks. 


In either case--known knowns or known unknowns--people have some semblance of certainty as there are boundaries around risk.  


The other two categories involve higher levels of risk, as uncertainty is greater. 


“Unknown unknowns” arguably pose the greatest risk, as the existence of the risk factors is not understood, not seen, not believed to be risk factors. Perhaps the Covid-19 pandemic is an example of that. 


“Unknown unknowns” are future outcomes, events, circumstances, or consequences that we cannot predict. We also cannot plan for them. We don’t even know when and where to search for them.


source: Market Business News 


“Unknown knowns” are things that exist, influence lives and our approach to reality, but are not perceived to do so. Or we do not see their significance or we refuse to acknowledge dangers. 


The issue is where to categorize a black swan event. A  black swan is an extremely rare event with severe consequences. It cannot be predicted beforehand. Some might say a black swan is an unknown known. We know they happen, but we cannot predict them. 


That categorization is based on the assumption that we know black swans happen, so we understand that much. But we still cannot predict when one will happen, or where. 


Alistair Croll and Benjamin Yoskovitz used the Knowns and Unknowns framework in their book Lean Analytics to describe different ways of looking at data:


  • Known Knowns (facts): you use analytics data to check those facts against them.

  • Known Unknowns (hypotheses): can be confirmed or rejected with measurements.

  • Unknown Knowns (our intuitions and prejudices): can be put aside if we trust the data instead.

  • Unknown Unknowns (it can be anything!): are often left behind, but can be the source of great insight. By exploring the data in an open-minded way, we can recognise patterns and hidden behaviour that might point to opportunities.


source: Marvel 


This framework also is used by the Johari Window


Not "In the Top 10?" No Matter

It has been commonplace for decades to hear it said that the United States is not in the top 10 globally for internet access speed or some other metric. Over the last few decades, it has been argued that the United States similarly was not “in the top 10 globally” for use of text messaging or mobile phones, for example. 


Most recently, it had been argued that the U.S. was falling behind in 5G.  


It has been argued that the United States was behind, or falling behind, for use of smartphones, broadband coverage, fiber to home, broadband speed or broadband price, for example. Likewise, some argued that U.S. customers were “behind” Japan or South Korea on some metrics related to use of digital apps. 


And U.S. average mobile speeds were slow, historically, compared to other developed nations. 


So the “U.S. is behind” storyline is quite familiar. Of course, we might note that the same thing was said about U.S. fixed network telephone service. The U.S. installed base metrics rarely exceeded 12th to 15th globally. 


Some even have argued the United States was falling behind in spectrum auctions. That clearly also has proven wrong. What such observations often miss is a highly dynamic environment, where apparently lagging U.S. metrics quickly are closed.


To be sure, adoption rates have sometimes lagged other regions, early on. But there is a pattern here: early slowness is overcome; performance metrics eventually climb; availability, price and performance gaps are closed over time. 


The early storylines often are correct, as far as they go. That U.S. internet access is slow and expensive, or that internet service providers have not managed to make gigabit speeds available on a widespread basis, can be correct for a time. Those storylines rarely--if ever--hold up long term. U.S. gigabit coverage now is about 80 percent, for example. 


Other statements, such as the claim that U.S. internet access prices or mobile prices are high, are not made in context, or qualified and adjusted for currency, local prices and incomes or other relevant inputs, including the comparison methodology itself. 


Both U.S. fixed network internet prices and U.S. mobile costs have dropped since 2000, for example. 


What observers always forget is the huge amount of the U.S. land surface that is highly rural or unsettled. About 94 percent is unsettled or lightly populated, including mountains, rangeland, cropland and forests. 


In fact, most people live on just six percent of the U.S. land surface, according to the USDA. Also, the United States, like Canada, Australia, Russia and China, are continent-sized areas. Building networks takes longer when larger areas must be covered. 


All that has direct implications for the cost and speed of building networks. Dense urban networks cost the least, on a per-location basis, while rural networks cost the most. Also, incentives to build and operate networks are strongest on six percent of the land surface, and challenging on as much as 94 percent of the land surface. 


The point is that the United States rarely--if ever--ranks in the top 10 on any indicia of communications performance. In fact, it is more realistic to argue that U.S. will rank 19th to 20th on almost any measure of teledensity or communications supply. 


A corollary is that rankings do not matter. Nobody would allege that a “not in the top 10” ranking has any apparently negative impact on productivity, innovation or economic growth.  The claimed U.S. applications usage gap has not mattered for U.S. based application firms. 


There is always “some other place” where customers and users do more with a particular application or use case. It never seems to matter, ultimately. Teledensity and other measures of connectivity supply are inputs. What matters is output, the ability to create value from the use of such assets. 

Wednesday, September 8, 2021

Internet Access Got Dramatically Better--60% for Mobile, 32% for Fixed--Over the Last Year

Despite perennial complaints that internet access simply is not available enough, cheap enough or good enough, global internet access keeps getting faster, more available and arguably even more affordable. 


According to Ookla, mobile download speed improved 60 percent  over the last year globally, while fixed broadband speeds got 32 percent faster. 


The global mean of download speeds improved over the last 12 months on both mobile and fixed broadband to 55.07 Mbps (mobile) and 107.50 Mbps (fixed network) in July 2021, Ookla says.  


Mean (average) download speed over mobile was 99 percent faster in July 2021 than in July 2019, 141 percent faster when comparing July 2021 to July 2018, and 194 percent faster when comparing July 2021 to June 2017.
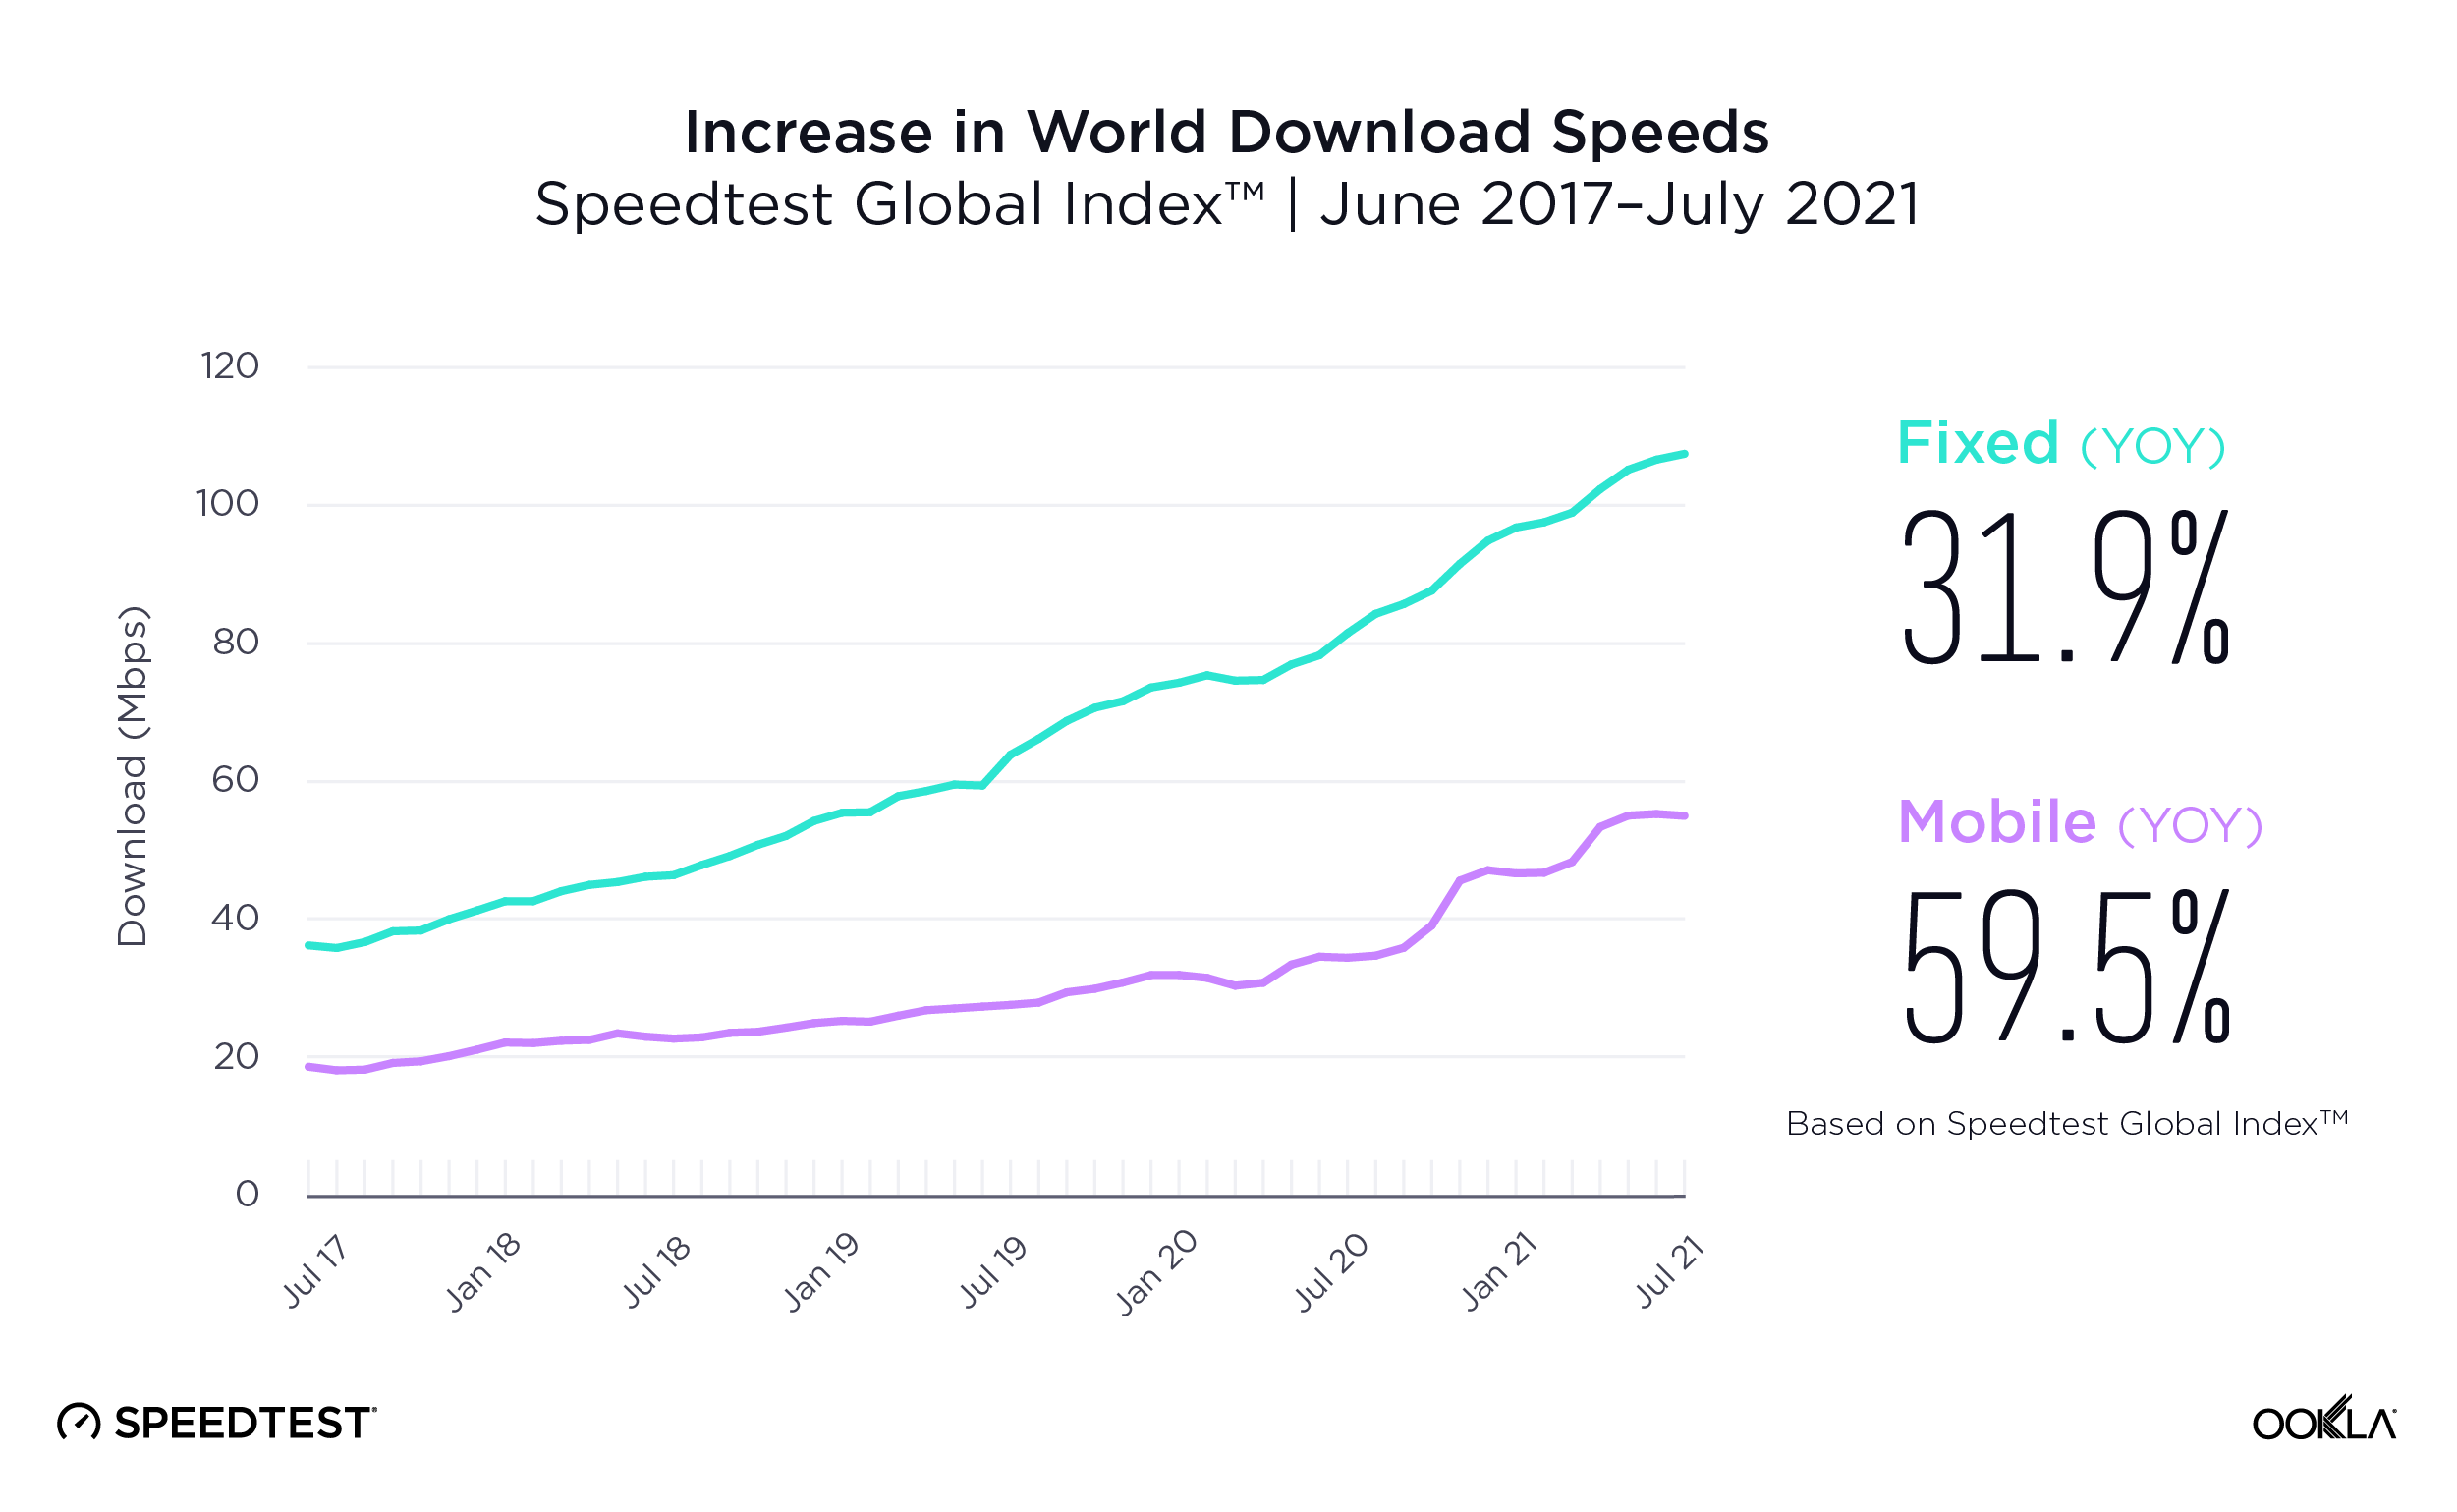
 ookla_global-index_world-speeds_0921-1

source: Ookla 


On fixed networks, mean download speed was 68 percent faster in July 2021 than in July 2019, 131 percent faster in July 2021 than in July 2018 and 196 percent faster in July 2021 than in June 2017.


On the price front, observers sometimes cite posted retail prices and argue that “ prices are too high.” That remains true in many developing countries, but in developed countries the story is not correct. Internet access is not very expensive


When some claim prices are too high, the typical argument is that U.S. a la carte prices (the retail tariff for internet access, not purchased in a bundle) are higher than prices in other countries.  


Adjusting for currency and living cost differentials, however, broadband access prices globally are remarkably uniform. 


The 2019 average price of a broadband internet access connection--globally--was $72..92, down $0.12 from 2017 levels, according to comparison site Cable. Other comparisons say the average global price for a fixed connection is $67 a month. 


Looking at 95 countries globally with internet access speeds of at least 60 Mbps, U.S. prices were $62.74 a month, with the highest price being $100.42 in the United Arab Emirates and the lowest price being $4.88 in the Ukraine. 


According to comparethemarket.com, the United States is not the most affordable of 50 countries analyzed. On the other hand, the United States ranks fifth among 50 for downstream speeds. 


Another study by Deutsche Bank, looking at cities in a number of countries, with a modest 8 Mbps rate, found  prices ranging between $50 to $52 a month. That still places prices for major U.S. cities such as New York, San Francisco and Boston at the top of the price range for cities studied, but do not seem to be adjusted for purchasing power parity, which attempts to adjust prices based on how much a particular unit of currency buys in each country. 


The other normalization technique used by the International Telecommunications Union is to attempt to normalize by comparing prices to gross national income per person. There are methodological issues when doing so, one can argue. Gross national income is not household income, and per-capita measures might not always be the best way to compare prices, income or other metrics. But at a high level, measuring prices as a percentage of income provides some relative measure of affordability. 


Looking at internet access prices using the PPP method, developed nation prices are around $35 to $40 a month. In absolute terms, developed nation prices are less than $30 a month. 


According to a new analysis by NetCredit, which shows U.S. consumers spending about 0.16 percent of income on internet access, “making it the most affordable broadband in North America,” says NetCredit.  


In Europe, a majority of consumers pay less than one percent of their average wages to get broadband access, NetCredit says. In Singapore, Hong Kong, New Zealand and Japan,  10 Mbps service costs between 0.15 percent and 0.28 percent of income. 


A normalization technique used by the International Telecommunications Union is to attempt to compare prices to gross national income per person, or to adjust posted retail prices using a purchasing power parity method. 


source: ITU 


Gross national income is not household income, and per-capita measures might not always be the best way to compare prices, income or other metrics. But at a high level, measuring prices as a percentage of income provides some relative measure of affordability. 


Looking at internet access prices using the purchasing power parity method, developed nation prices are around $35 to $40 a month. In absolute terms, developed nation prices are less than $30 a month.  


First of all, the product people buy is different over time. Customers are buying faster packages than they used to. To the extent that faster tiers of service cost more, “average” prices will climb. On a cost-per-Mbps basis, costs are dropping. 


But there are limits to price levels. Consumers will only spend so much on internet access. That figure tends to a small percent of household income, with all forms of communication service spending amounting to perhaps 


Prices for fixed network service have dropped about 92 percent over the last decade, for example, on a cost-per-megabit-per-second basis. Customers also use much more data than they used to, as well. Competition accounts for some of the improvement, even if observers sometimes argue “there is no competition” for consumer broadband services.  


The point is that internet access keeps getting better, and more affordable as well.


AI Will Improve Productivity, But That is Not the Biggest Possible Change

Many would note that the internet impact on content media has been profound, boosting social and online media at the expense of linear form...