Thursday, November 12, 2020

U.S. Gigabit Take Rates Pass 5% for First Time

The percentage of U.S. fixed network broadband subscribers buying gigabit-speed connections surpassed five percent for the first time in the third quarter of 2020, reaching 5.6 percent, according to Openvault. That represents an increase of 124 percent from the third quarter of 2019, when take rates for gigabit services were 2.5 percent.


Gigabit service take rates reached 4.9 percent in the second quarter of 2020, says Openvault. Compare that to availability of gigabit services, which reach at least 80 percent of U.S. homes, counting only cable TV service provider facilities.


source: Openvault 


On the other hand, buyers of service at 10 Mbps and below also increased by 41 percent,  from 4.1 percent to 5.8 percent, quarter over quarter, Openvault says. “Growth at the lower end tier may be pointing to subscribers looking to save money with lower end, lower cost broadband tiers,” Openvault says.


Openvault says the “average” U.S. household (no idea whether this is median or mean) uses 384 GB per month, with average speeds downstream of 170 Mbps, upstream of 13 Mbps. 

source: Openvault

Half of all customers buy services providing downstream speeds between 100 Mbps and 400 Mbps. Nearly 30 percent of U.S. customers buy internet access at speeds ranging from 20 Mbps to 75 Mbps.

So it remains fair to say that there is a big difference between speeds consumers can buy, and speeds they actually do buy. Supply is one matter; demand another.

Impact of Covid on Telecom, IT Spending Not Yet Completely Clear

When all the data is available, it is likely we will find that the Covid-19 related work-from-home and other measures reduced global service provider revenues  a couple of percentage points, though some firms might have seen far-worse hits, and some see higher revenues


Overall, full-year global results might show less than one percentage slippage of service provider revenue, IDC predicts. 


source: IDC 


And in many cases, it will be hard to separate specific Covid-19 impact from the underlying trend of declining growth. Something similar might happen for information technology spending, even for cloud services which have been on a steady growth path.


Though it might seem obvious that information technology executives increased cloud computing spend to support remote workers during the Covid-19 pandemic, it is not yet so clear how much spending actually might have changed. It is possible we might actually see spending fairly close to what had been predicted prior to the pandemic. 


An October 2020 survey of 230 information technology professionals by OpsRamp finds 60 percent of firms increased IT budgets while 22 percent reduced spending in the second and third quarters of 2020. Some 63 percent of respondents reported accelerated or maintained digital transformation initiatives because of Covid-19.


The survey included IT professionals in the United States and United Kingdom working for firms with  at least 500 employees and $5 million in annual IT budgets. 


Reported priorities for IT leaders included information security and compliance (59 percent), remote work and collaboration (55 percent), public and multi-cloud infrastructure (50 percent) and monitoring and management (42 percent). 


Among capabilities acquired were artificial intelligence for IT operations (57 percent); digital experience monitoring (50 percent) and network performance monitoring and diagnostics (50 percent). 


A Computer Economics survey in August and September 2020 finds a split pattern of information technology operations spending: 30 percent increasing spending while 29 percent were decreasing. About 41 percent of respondents say there has been no change in spending. 


Back in April and May 2020, 41 percent of respondents reported unchanged spending. But 30 percent already had made moves to reduce IT budgets in response to  To the extent there had Covid-19 work from home rules.


Fig. 1: Organizations Planning Operational Budget Changes

source: Computer Economics


The 30 percent of respondents who reported cutting spending seems not to have budged much. In the fall, the percentage of respondents reporting lower spending was still 29 percent, substantially the same as the 30 percent who reported cuts in April and May 2020. 


What changed was the percentage of respondent firms that boosted spending, probably for hardware, software or services related to supporting remote workers. “Of course, the big reason for increasing budgets is to respond to the increased need for employees to work from home,” said David Wagner, Computer Economics senior research director. 


Fig. 1: Organizations Planning Operational Budget Changes

source: Computer Economics 


It is hard to separate out the response to Covid-19 remote work on cloud computing, which has been growing robustly before the work-from-home mandates were imposed. And even some firms that one might assume boosted cloud spending to support at-home workers eventually reduced spending from surge levels. 


Some studies suggest cloud revenue growth from 2020 to 2021 will be about 12.5 percent, perhaps lower than many would have expected, even under normal circumstances. The only issue is whether the work-from-home rules affected cloud computing uptake rates. And that might ultimately be a different matter from earlier expectations that cloud computing among smaller businesses, for example, would increase because of the pandemic. 


To some degree, the changes might hinge on whether customers are active about turning off or reducing payment for unused cloud services. It also will matter how much aggregate demand changed when workers shifted from offices to homes. In principle, that might have shifted the location of consumption, but not the volume of use. 


Though early in the pandemic many expected increased reliance on cloud computing, beyond growth already expected, we will have to wait and see what actually transpired. Covid impact might ultimately turn out to have been less of a change inducer than we expected. 

Tuesday, November 10, 2020

Alphabet's Taara to Deploy Free Space Optics in Kenya

Alphabet’s Project Taara is now working with Econet and its subsidiaries, Liquid Telecom and Econet Group, to commercially deploy free space optics trunking systems in Sub-Saharan Africa. The initial use cases will involve signal trunking across rivers or transmission through any other areas where it would be expensive, difficult or dangerous to lay physical cables, or where microwave radio would be the logical alternative,


source: Alphabet 


Taara’s links will begin rolling out across Liquid Telecom’s networks in Kenya first.


A single Taara link can cover distances up to 20 km and can transmit bandwidth of up to 20 Gbps or more, Taara says. The technology is a point-to-point trunking approach originally investigated to support Alphabet’s Project Loon internet access system using balloons.


In that use case, the problem to be solved was creation ofdata links between balloons that were flying over 100 km apart.


But free space optics has been proposed as a point-to-point trunking solution for decades in niche applications such as sending video security camera signals from remote locations to monitoring stations. 


The deployments illustrate how some technologies take decades to reach even relatively limited commercial use in the connectivity business.

When a Bug is a Feature

Somes a bug can be a feature. Consider atmospheric attenuation of radio frequency signals at 60 GHz, At that frequency, oxygen in the atmosphere attenuates about 98 percent of the emitted energy. That limits coverage. 


So it might be paradoxical that Terragraph is working to commercialize use of 60-GHz frequencies for internet access. At the same time, many internet access providers say they are going to use fixed wireless for internet access. 

source: RF Globalnet


One advantage of 60-GHz spectrum, in the U.S. market and in most countries is that the spectrum is available for unlicensed use. That has huge business case  implications for service providers compared to the alternative of building fiber-to-location networks. 


In the U.S. market, where consumer internet access is dominated by cable TV companies, fixed wireless might be the main way telcos can compete with cable offers. When the cable operator has about 70 percent of the installed base, the fiber to home cost per passing or cost per customer is a tough business case. 


In addition to no requirement to pay for a license to use the spectrum, the bandwidth is huge, about 14 GHz of capacity in the 57 GHz to 71 GHZ band available for U.S. unlicensed use. 


Another advantage is security. Because signal attenuation is so high, stray signals are confined. In an indoor Wi-Fi deployment, the signals will not often “leak” out of the building. In an outdoor access deployment, the signals can be highly linear, reducing the chances of accidental or purposeful unauthorized signal reception. 


There are interference protection advantages as well, In an indoors Wi-Fi deployment (local area network), adjacent 60-GHz transmitters are less likely to interfere with each other, which causes a reduction in experienced speeds and capacity. 


The same goes for line-of-sight, or near line-of-sight 60-GHz access transmitters: signals from one radio are less likely to interfere with signals from other transmitters.


Frequency reuse opportunities also are quite high, again a function of the “bug” of extremely-high signal attenuation. In the same way that small cells boost the intensity of usage for any specific block of spectrum, so 60-GHz signal attenuation allows a high degree “cellular” frequency reuse. 

source: RF Globalnet


Though high signal attenuation would seem to be a major bug, it might also be a key feature for 60-GHz frequency internet access. 


Monday, November 9, 2020

No, Covid-19 Has Not Been Good for the Telecom Business

An argument I have frequently heard, from professionals in the telecom industry, is how the Covid-19 pandemic “must” be good for service provider revenues, since so many people were forced to work from home, and therefore were using more telecommunications. 


The reality is that revenues are down, as you would otherwise expect in a situation where whole economies are nearly shut down. The functional result is a recession, and recessions cause lower service provider revenue. 


source: IDC 


Also, lockdowns keeping people at home hit roaming revenue, and given that mobile services generate a clear majority of global service provider revenue, that has hit both revenue and earnings. 


Add to that bankruptcies of significant numbers of small businesses and organizations, and aggregate demand is reduced.


All of that happens within the context of a global business experiencing slow to no growth. 


source: IDC 


The point is that even professionals who work in the industry can have distorted views of what is happening in the business, especially the impact of the pandemic and economic lockdowns.


Sunday, November 8, 2020

Irresistible Storylines That Always are Wrong

Some storylines are irresistible. Slow U.S. 5G speeds provide an example. A classic storyline about U.S. telecommunications is “U.S. is behind.”


Author Steven Pressfield, in his book Nobody Wants to Read Your Sh*t, points out the elements of any story. These universal principles of storytelling include:

1) Every story must have a concept. It must put a unique and original spin, twist or framing device upon the material.

2) Every story must be about something. It must have a theme.

3) Every story must have a beginning, a middle, and an end. Act One, Act Two, Act Three.

4) Every story must have a hero.

5) Every story must have a villain.

6) Every story must start with an Inciting Incident, embedded within which is the story’s climax.

7) Every story must escalate through Act Two in terms of energy, stakes, complication and significance/meaning as it progresses.

8) Every story must build to a climax centered around a clash between the hero and the villain that pays off everything that came before and that pays it off on-theme.


That is a framework often used when writers talk about the state of U.S. telecommunications. U.S. 5G speeds are slow, compared to most other markets. There are reasons. U.S. service providers are relying on low-band spectrum for coverage, and that necessarily limits speeds. Most of the leading U.S. mobile operators, with the exception of T-Mobile, have little mid-band spectrum, which is the preferred band globally.


So U.S. mobile speeds are slow, and have been relatively slow, even for 4G services. 


That is a necessary evil at the moment, as there is little unencumbered mid-band spectrum available at the moment, in the U.S. market, though that will change as more mid-band spectrum is reallocated for mobile use. 


But the “U.S. is behind” storyline has been used often over the last several decades. Indeed, where it comes to plain old voice service, the U.S. is falling behind meme never went away.


In the past, it has been argued that the United States was behind, or falling behind, for use of mobile phones, smartphones, text messaging, broadband coverage, fiber to home, broadband speed or broadband price


In the case of mobile phone usage, smartphone usage, text message usage, broadband coverage or speed, as well as broadband prices, the “behind” storyline has proven incorrect, over time. 


Some even have argued the United States was falling behind in spectrum auctions. That clearly also has proven wrong. What such observations often miss is a highly dynamic environment, where apparently lagging U.S. metrics quickly are closed.


To be sure, adoption rates have sometimes lagged other regions. Some storylines are repeated so often they seem true, and lagging statistics often are “true,” early on. The story which never seems to be written is that there is a pattern here: early slowness is overcome; performance metrics eventually climb; availability, price and performance gaps are closed over time. 


The early storylines often are correct, as far as they go. That U.S. internet access is slow and expensive, or that internet service providers have not managed to make gigabit speeds available on a widespread basis, can be correct for a time. Those storylines rarely--if ever--hold up long term. U.S. gigabit coverage now is about 80 percent, for example. 


Other statements, such as the claim that U.S. internet access prices or mobile prices are high, are not made in context, or qualified and adjusted for currency, local prices and incomes or other relevant inputs, including the comparison methodology itself. 


Both U.S. fixed network internet prices and U.S. mobile costs have dropped since 2000, for example. 


The point is that the “U.S. is behind” storyline seems irresistible. That storyline has always proven incorrect, though, over time. The historically-accurate storyline is that “slow start” is what we see. Over some time, U.S. metrics tend to rise to about 12th to 15th globally, but no higher, ever. 


The bottom line is that it is quite typical for U.S. performance for almost any important new infrastructure-related technology to lag other nations. It never matters, in the end. 


Eventually, the U.S. ranks somewhere between 10th and 20th on any given measure of technology adoption. That has been the pattern since the time of analog voice. 


We often forget that six percent of the U.S. landmass is where most people live. About 94 percent of the land mass is unpopulated or lightly populated. And rural areas present the greatest challenge for deployment of communications facilities, or use of apps that require such facilities.

Saturday, November 7, 2020

Combining Network Access and Apps Businesses a Growing Trend

Are new service provider models--combining connectivity and apps--emerging? Some point to the examples of Rakuten, the Japanese online e-tailer that also has entered the mobile service provider business, or Reliance Jio, which includes both the Reliance Jio mobile business and a collection of digital content, transactions and apps businesses. 


Others would point to moves by telcos and cable companies into content ownership.


Infrastructure is intersecting with digital services such as you have seen with Rakuten and Jio,” says Steve Mollenkopf, Qualcomm CEO. 


Others might add moves by the likes of Google, Facebook into connectivity service provider businesses (satellite, fiber to the home, mobile service provider) or infrastructure (Telecom Infra Project) or devices (e-readers, smart speakers, video streaming devices). 


In fact, what all those moves show is expansion across the internet value chain by app providers into connectivity services, infrastructure and device portions of the ecosystem. Connectivity providers have made some moves into new applications, primarily entertainment video, and some are hopeful about new roles in edge computing or the internet of things.


At least so far, one might well argue that it has proven easier for app providers to move into adjacencies than for connectivity providers to do so. 


It might be a fruitful question to ask why that is the case, as any move into adjacent value chain roles involves moving outside the area of core competency. Such moves often also involve mastery of functions higher or lower on the protocol stack, so there is a possible challenge in terms of moving up the stack or down the stack.


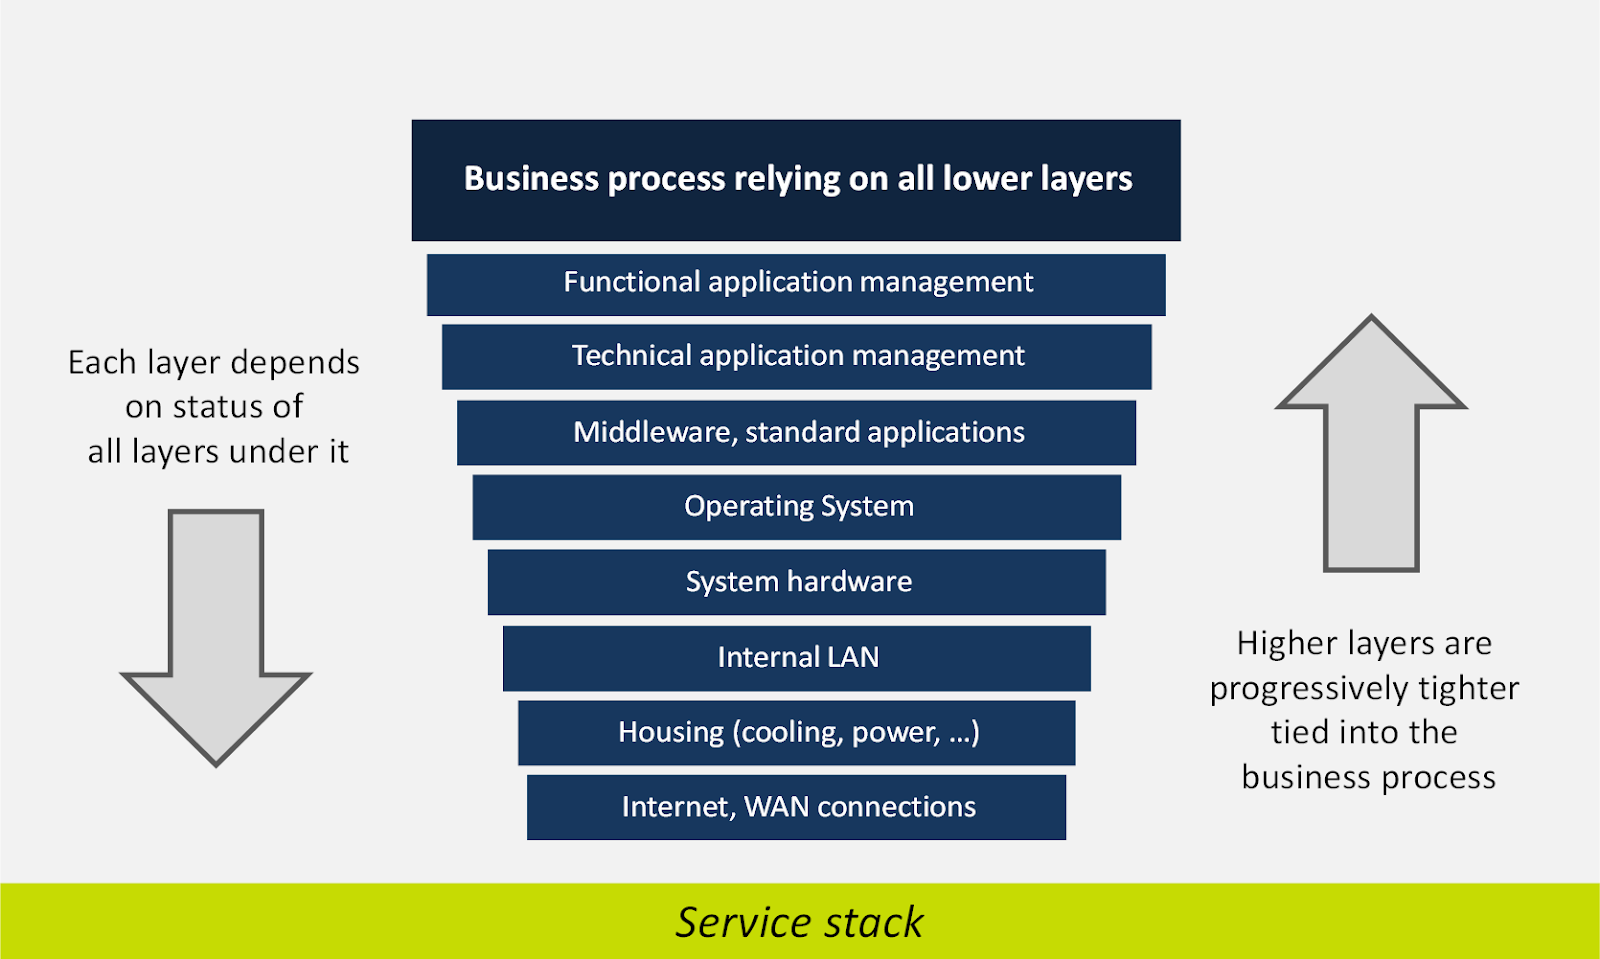
source: Vermont IT Group


Some might argue it is--all other things being equal--easier to move down the stack than up the stack. When moving down the stack, the entity making the move is the “end user” or “business process” provider. Put simply, the advantage is that the business process provider knows exactly what it requires from lower levels of the stack. 


Matters are different for an entity moving from lower in the stack to higher levels. Lower levels increasingly are “horizontal” in focus, designed to support literally any conceivable buyer, entity or business function. A connectivity network is designed to support any device or user with a need for internet protocol communications, or any device using a specific standard, such as 4G or 5G or Wi-Fi. 


That is a lowest common denominator approach, and makes sense. In contrast, a business process provider knows precisely what it requires from lower levels, as those levels support its specific business. In many cases, it is not so much features but costs that are of concern. 


As “same functionality, lower price” or “higher functionality, lower price” always is an easily understood value proposition, so too are business process provider value drivers when moving down the stack. The reason hyperscale app providers build and own their own subsea networks is that they get what they want at lower overall costs. 


In other words, the business process provider knows precisely what it requires. The companies lower in the stack “have to guess” at what potential buyers will want, and have to be prepared to support all potential buyers (lowest common denominator) or optimize for a few verticals. 


The lowest common denominator strategy offers the greatest potential scale, but also the least differentiation. That is one reason many believe network slicing--the ability to create custom virtual private networks with distinct performance characteristics--is important. 


Network slicing might solve this problem (lowest common denominator versus optimized features), as experienced by connectivity providers.


There are some other, perhaps more subtle advantages for business process providers moving down the stack. Ubiquitous internet access helps app providers since their ability to gain and keep a customer requires internet access. That makes hyperscale app providers big supporters of ubiquitous, high quality, affordable internet access.


There are fewer obvious synergies for entities trying to move up the stack. It is hard to displace dominant suppliers in any of the stacks, so it almost always makes sense to specialize or differentiate when moving into any new adjacency, and especially up the stack. 


But that also poses a problem of scale, as differentiation necessarily means aiming for a segment of the market. Essentially, that narrows the potential financial return. Consider the possible roles for connectivity providers as internet of things platforms. 


Most would likely agree that no single provider can be successful in every business vertical. So Verizon has attempted to be a platform provider in the automotive space, and pitches its ThingSpace as a platform for connecting IoT devices to Verizon’s network. Some might note that the “platform” is mostly subscriber identification modules providing the communication function on Verizon’s mobile network. Some will question whether that is what it meant by the term “platform.”


Still, possible moves up or down the stack seem a growing issue for some tier-one service providers, simply because revenue growth opportunities in the core business are reaching, or already have reached, saturation. That can be seen in the percentage of total revenue coming from outside the communications service core. 


source: GSMA 


As this chart suggests, tier-one service providers are betting on growth outside their legacy communications core, and many have made substantial progress. 


If it is true that infrastructure and apps/content businesses are becoming synergistic, we can expect to see more moves blending the two--connectivity and apps--in the future, under common ownership.


Governments Likely Won't be Very Good at AI Regulation

Artificial intelligence regulations are at an early stage, and some typical areas of enforcement, such as copyright or antitrust, will take...