Google Fiber will launch 5-Gbps and 8-Gbps internet access service in early 2023. Both products will offer symmetrical upload and download speeds, Google says.
Google Fiber launched gigabit service in 2010, 2-Gbps service in 2020 and (and is testing 20-Gbps service.
The 5-Gbps tier will cost $125 per month, while the 8-Gbps tier will cost $150 per month.
Separately, it seems increasingly likely that Comcast will begin to introduce service at speeds possibly in the 4-Gbps to 6-Gbps range in 2023. And those services might well be symmetrical, able to extend to 10-Gbps symmetrical.
Those speed increases are predictable and expected according to two theorems.
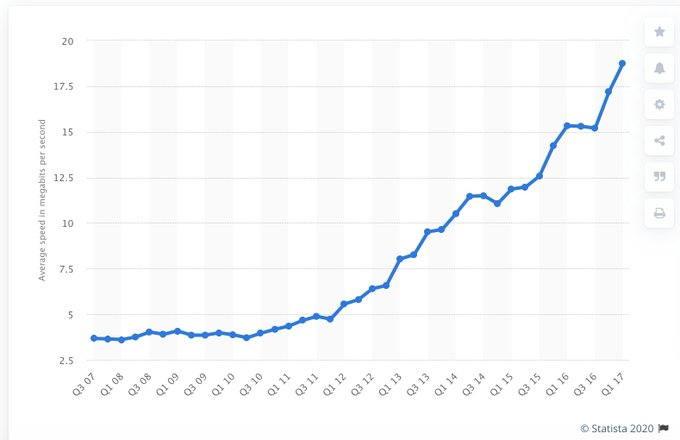
Nielsen's Law suggests that the top-end speed will grow 50 percent per year. Edholm’s Law states that internet access bandwidth at the top end increases at about the same rate as Moore’s Law, which is about a doubling every 18 months or so.
That means the top-end home broadband speed could be 85 Gbps to 100 Gbps by about 2030.

Nielsen Norman Group estimates suggest a headline speed of 10 Gbps will be commercially available by about 2025, so the commercial offering of 2-Gbps and 5-Gbps is right on the path to 10 Gbps.
AT&T, for example, just activated symmetrical 2-Gbps and symmetrical 5-Gbps service for 5.2 million locations across 70 U.S. markets, with plans to deploy across the whole footprint in 2022 and later years.
There is widespread expectation that the headline speed for home broadband, in many markets, will be 10 Gbps by about 2025.
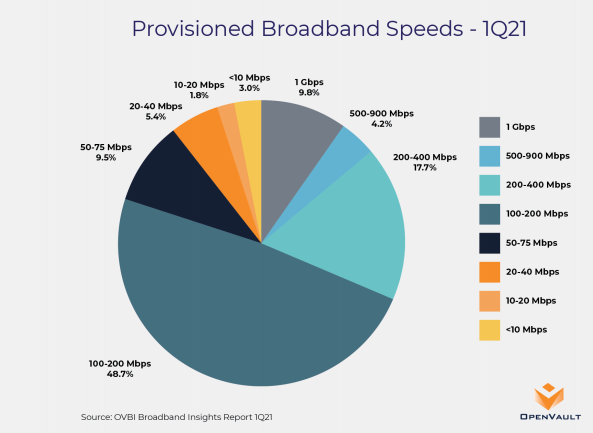
By other rules of thumb, that also suggests the "typical" home broadband customer will be buying service at rates between 1 Gbps and 2 Gbps, with a significant percentage buying service at 4 Gbps.
Nielsen’s Law has operated since the days of dial-up internet access. Even if the “typical” consumer buys speeds an order of magnitude less than the headline speed, that still suggests the typical consumer--at a time when the fastest-possible speed is 100 Gbps to 1,000 Gbps--still will be buying service operating at speeds not less than 1 Gbps to 10 Gbps.

So top end speeds in the terabits per second are virtually inevitable by about 2050. The emergence of offers between 2 Gbps and 5 Gbps now is simply evidence that the trend continues.
At the moment, top speeds in the U.S. market are in the 2 Gbps and 5 Gbps ranges.Comcast has introduced 3-Gbps services for business. Ziply has introduced symmetrical 2-Gbps service. Google Fiber has added 2-Gbps as well.
Frontier Communications is doing the same. Verizon offers 2-Gbps Fios service. AT&T sells both 5-Gbps and 2-Gbps service. Many of those offers feature symmetrical bandwidth.
Perhaps the greatest value change, though, is not the headline downstream speed, but the symmetrical speeds, as in the U.S. market asymmetrical services sold by cable operators have nearly 70 percent market share.
Though the cable hybrid-fiber coax networks can be configured to support more upstream bandwidth, fully-symmetrical service typically requires switching to fiber-to-the-home platforms.
To scale new capital investments, cable operators in many cases will choose to extend downstream speeds and lift upstream speeds, approaching or reaching fully symmetrical service with DOCSIS 4.0 before considering other measures such as switching to FTTH.
If the “typical” customer buys a service operating at up to an order of magnitude less than the highest headline speed, we might infer that the typical home account--offered by ISPs with various speed plans--will be buying service at speeds between 500 Mbps and 800 Mbps in 2025.
Keep in mind that Google Fiber’s footprint is quite limited, so not many households will be able to buy Google Fiber service, now generally available at either 1-Gbps or 2-Gbps speeds. In such cases, the headline speed and the median speed tend to be virtually identical.
The real local market test will tend to be the 2-Gbps to 5-Gbps services sold by Comcast, which has the biggest home footprint, or AT&T, with perhaps the third-biggest footprint. But those services are marketed mostly to business customers, at this point.